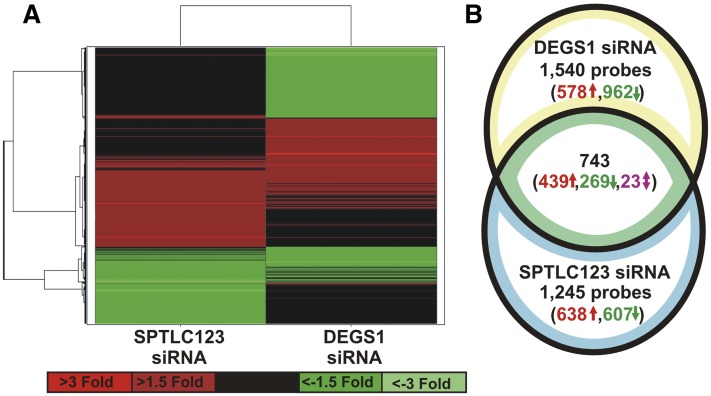
Fig. 3.
Global changes of gene transcription in Huh7 cells treated with SPTLC123 or DEGS1 siRNA. (A) Affymetrix microarray gene expression analysis was performed with RNA from Huh7 cells treated with scrambled, SPTLC123, or DEGS1 siRNA as described under Materials and Methods. (B) A Venn diagram grouping the 3,528 probes on direction of change observed across both targeted siRNA treatments was presented. The number of upregulated probes is red with an up arrow, and the number of downregulated genes is green with a down arrow. The number of probes with direction disagreement is magenta with a bidirectional arrow. A complete table for all 3,528 probes compared in this study containing the fold change, adjusted P value, and further annotation can be found in supplementary File III.

