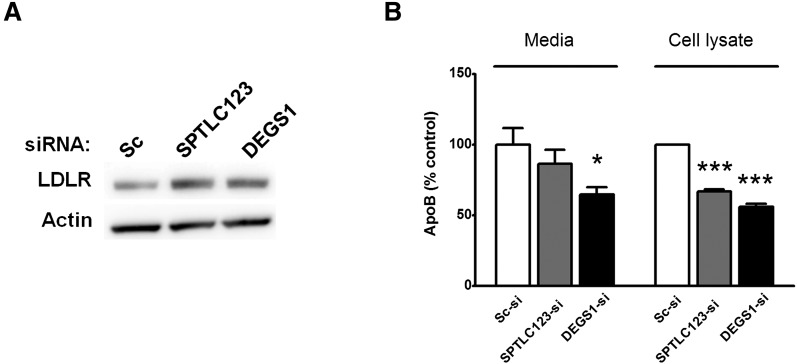
Fig. 4.
LDLR and apoB levels in SPTLC123- or DEGS1-silenced Huh7 cells. (A) A Western blot representation from three independent experiments illustrated the changes in LDLR protein level. β-actin antibody was used on the same blot to verify an equal protein loading in each lane. (B) Secreted and cellular apoB levels were determine by ELISA as described under Materials and Methods. (mean ± SEM, n = 3, *P < 0.05, ***P < 0.001).

