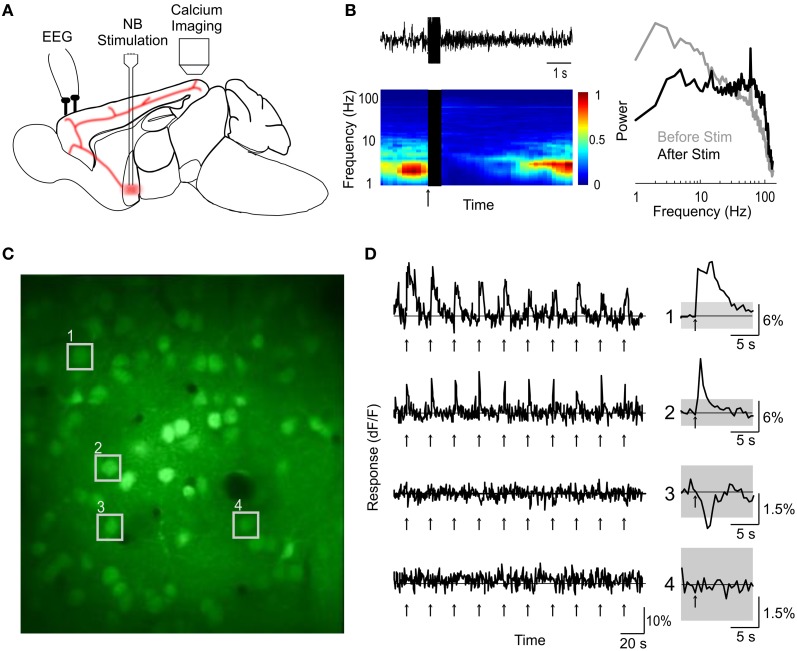
Figure 1.
Two-photon calcium imaging of basal forebrain modulation of cortical activity. (A) Schematic illustration of experimental design. (B) An example of cortical desynchronization induced by BF stimulation. Top left, EEG trace of a single trial. Bottom left, EEG spectrogram averaged from 10 trials; blue, low amplitude; red, high amplitude; black, period of BF stimulation; arrow, stimulus onset. Right, amplitude spectra during a 2 s period pre-(gray) and post-(black) stimulation, averaged from 10 stimulation trials. (C) An example fluorescence image of visual cortex loaded with OGB-1 (depth, 210 μm). (D) dF/F traces of four example cells (indicated by numbers in C) during a block of 10 trials of BF stimulation (arrows). Right, average response over the 10 trials. Gray shading, 4× SD of baseline. Cells 1 and 2 responded to BF stimulation with significant increases in calcium level, cell 3 showed a significant decrease, and cell 4 was not significantly modulated.

