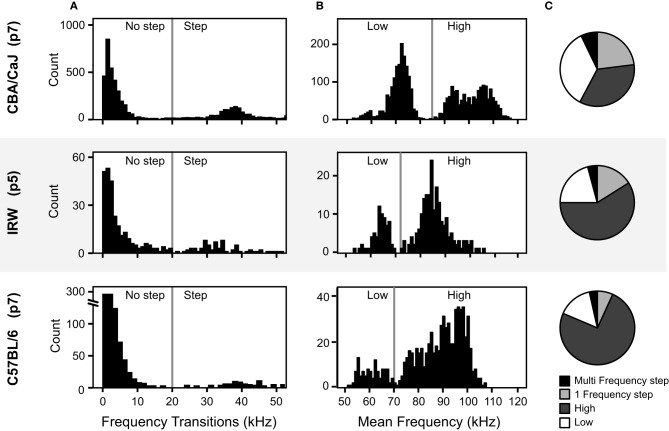
Figure 10.
Comparison of acoustic features of pup vocalizations in three mouse strains. (A) Distributions of the frequency transitions. The vertical lines at 20 kHz marks the criterion for a frequency step across the three strains. (B) Distributions of the average frequency of syllables without frequency steps. The vertical lines mark the boundary between high and low syllables, which differs among strains. (C) The proportion of each syllable type for the three mouse strains, based on the mouse syllable classification calculator.

