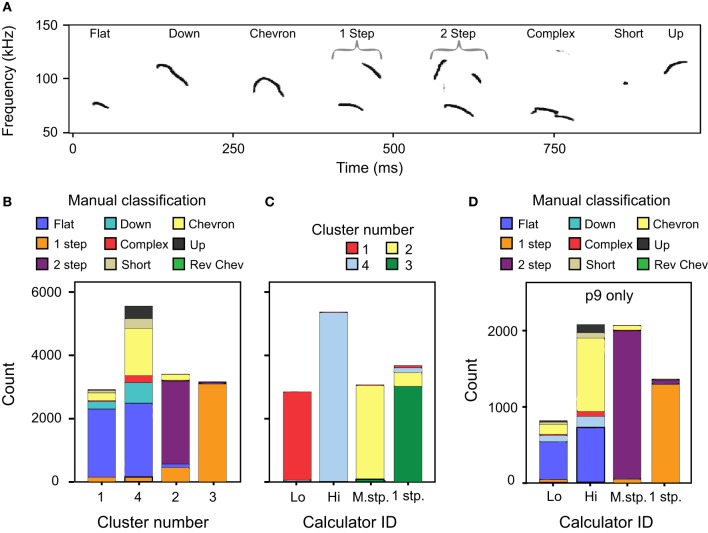
Figure 7.
A comparison of classification methods. (A) Spectrogram of typical examples of p4 syllables defined using manual classification (Grimsley et al., 2011). (B) Comparison between the cluster analysis and manual classifications across age. Manual classification of 1 frequency step and 2 frequency stepped syllables match well to the cluster analysis. However, manually classified syllable types with no frequency steps are split between c1 and c4. (C) Comparison between cluster analysis classification and the mouse syllable classification calculator for all ages except p9. (D) Comparison between manual classification and the mouse syllable classification calculator for a novel data set of calls emitted by p9 pups. These syllables were not used in the two-step cluster analysis that defined the number of syllable categories.

