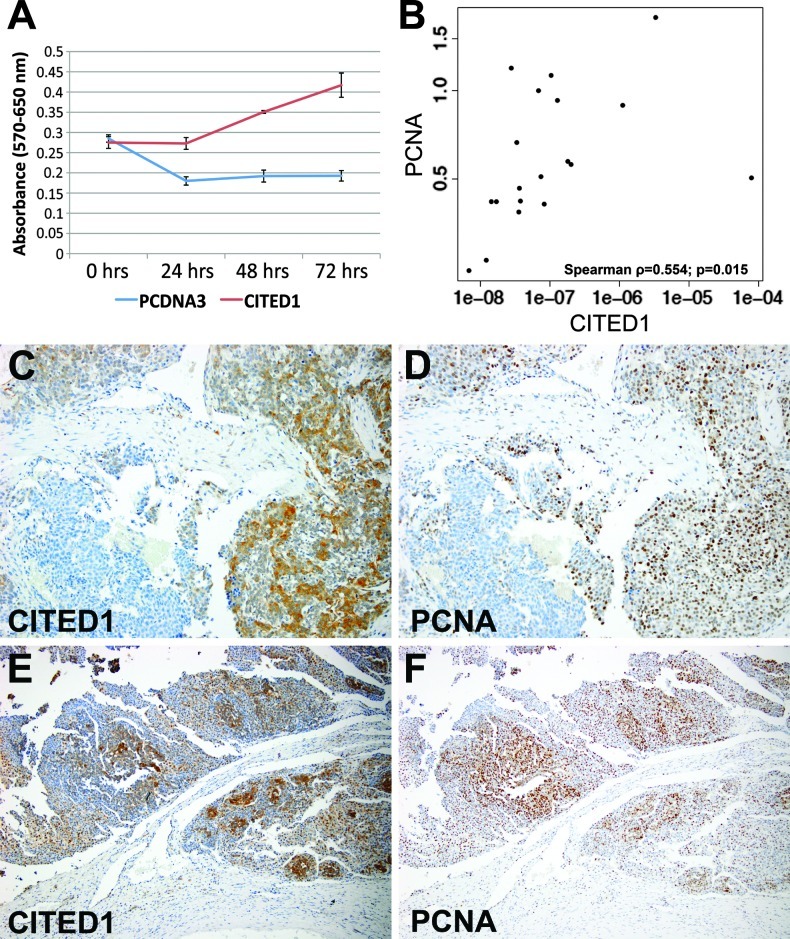
Figure 7.
(A) An MTT cell proliferation assay in ACL-4 media with 0.2% FBS demonstrates a significant increase in cellular proliferation at 24, 48, and 72 hours with CITED1 overexpression (method of Holm-Bonferroni; P < .05). (B) qRT-PCR of human hepatoblastoma specimens reveals a positive correlation between expression of CITED1 and the proliferative marker PCNA (Spearman correlation coefficient = 0.554; P =.015). (C and D) Serial hepatoblastoma tissue sections immunostained for (C) CITED1 and (D) PCNA demonstrate similar patterns of expression within a given tumor, supporting the correlation between CITED1 expression and cellular proliferation (original magnification, x200). (E and F) Additional serial sections stained for (E) CITED1 and (F) PCNA (original magnification, x100).

