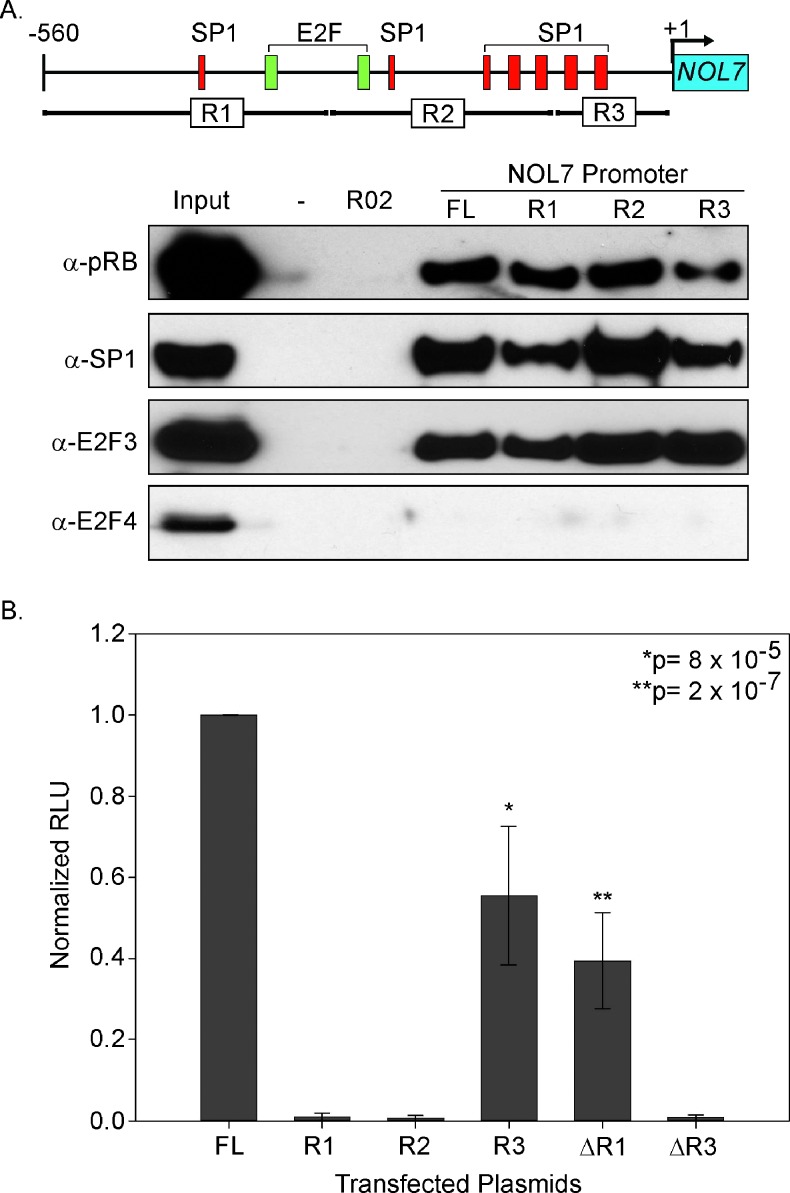
Figure 6.
pRB-TF complexes have multiple binding sites in the NOL7 promoter. (A) NOL7 promoter schematic depicting predicted E2F, SP1 binding sites, and NOL7 promoter subregions R1 to R3. SAPA analysis of the proteins coprecipitated with each promoter subregion by Western blot analysis. (B) Relative luciferase activity of the NOL7 promoter subregions R1 to R3, ΔR1 (R2 + R3), or ΔR3 (R1 + R2) represented as a fraction of the FL transfectants. The figure represents triplicate experiments with error bars corresponding to SEM.

