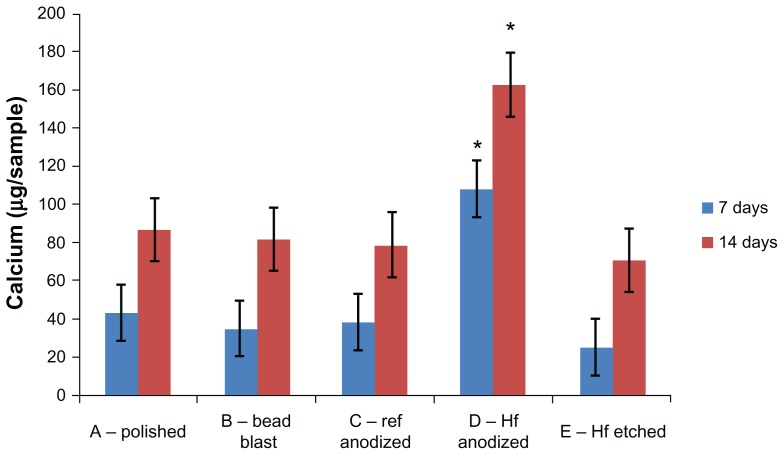
Figure 6.
Calcium deposition by osteoblasts on the samples of interest to the present study.
Notes: Values are mean ± SEM, N = 3. *P < 0.01 compared to all others at the same time period. For all samples, a significantly (P < 0.01) greater amount of calcium was found at increasing time periods.
Abbreviations: SEM, standard error of the mean; N, number.

