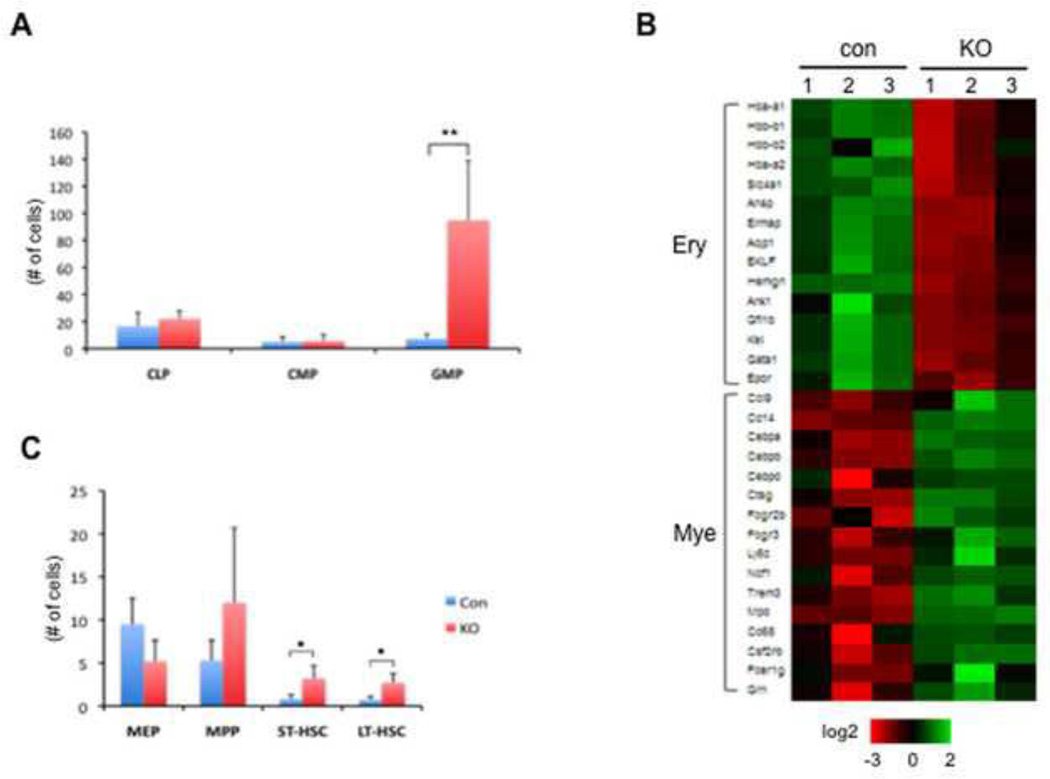
Figure 4. TIF1γ deficiency promotes myelopoiesis while inhibiting erythropoiesis.
(A) Increased number of GMPs in vav-cre; tif1γfl/fl mice at 3-month old. The absolute numbers of cells are shown as mean ± SD from 4 mice in each group (** q ≤ 0.001).
(B) Heat map showing regulation of genes representative of the erythroid signature and the myeloid signature from GMPs derived from vav-cre; tif1γfl/+ (con) and vav-cre; tif1γfl/fl (KO) mice.
(C) Increased HSC levels in vav-cre; tif1γfl/fl mice at 3-month old. The absolute numbers of cells are shown as mean ± SD from 4 mice in each group (* q ≤ 0.05).

