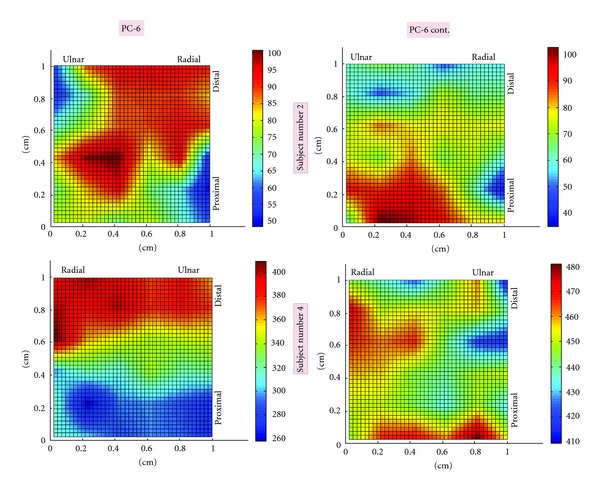
Figure 3.

Topographic maps of electrical potential at PC-6 and control sites. Representative topographic maps from two subjects are shown here. Images on the left correspond to PC-6 while the images on the right correspond to PC-6 control. The top images are derived from Subject number 2 and the bottom images are from Subject number 4. For each scan, a color bar is included to display electrical potential magnitudes.
