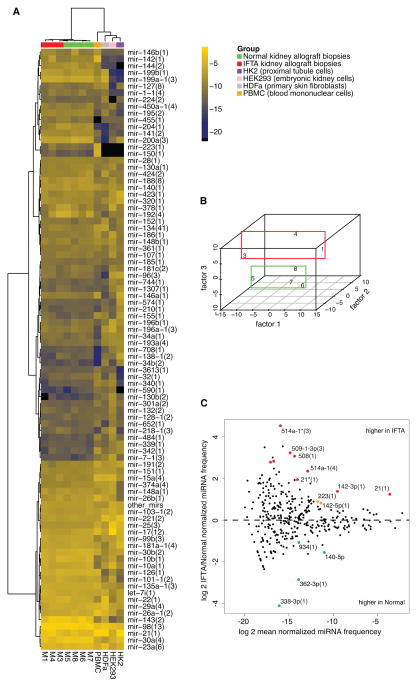
Figure 1. MicroRNA profiles generated by small RNA sequencing.
(A) Hierarchical clustering and heatmap representation of kidney allograft IFTA biopsy samples (M1, 3 and 4), Normal biopsies (M5, 6, 7 and 8), human peripheral blood mononuclear cells (PBMC), HDFa (primary skin fibroblast), HEK293 cells (human embryonic kidney cells) and HK2 cells (kidney proximal tubule cells) according to merged miRNA profiles (average linkage, Manhattan distance). MiRNA represented by fewer than 100 reads per sample (average) were collapsed into a single entry (‘other mirs’). Brighter shades represent higher expression, according to the color scheme shown on the side, in which the numbers correspond to the log-2 of the normalized read frequency (for example, −4 on the scale corresponds to 2−4 = 6.25% of all miRNA reads). (B) Multidimensional scaling showing separation of IFTA biopsies from Normal biopsies by the third factor. (C) MA plot generated using DESeq depicting differentially expressed miRNA sequence families. MiRNA higher in IFTA samples appear above the horizontal midline. Colored data points represent P-value < 0.05 (red points signify in addition FDR<0.1). See also Table S6.

