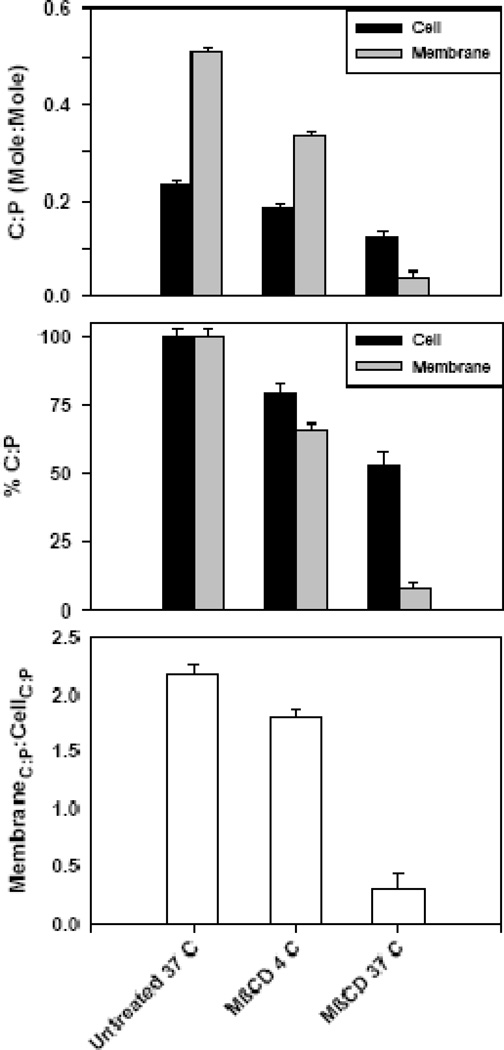
Figure 3. Cholesterol:phospholipid (C:P) at different extraction temperatures.
(A) C:P ratio for untreated and MβCD extracted HAB2 cells and their plasma membranes. Data are averages of 6 – 11 experiments.
(B) Normalized data from Fig. 4-A, where 100% is the ratio of cholesterol to phospholipids in untreated (control) samples.
C) Membrane C:P to Cell C:P, a measure of the relative concentration of cholesterol in the plasma membranes compared to intact cells.

