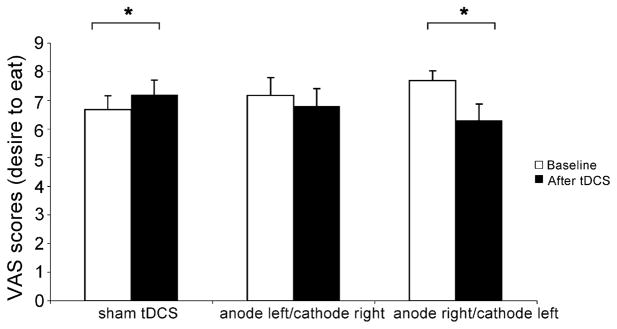
Fig. 1.
Food craving levels at baseline and after treatment for each condition (sham tDCS, anode left/cathode right tDCS and anode right/cathode left tDCS). Columns represent mean craving and error bars represent standard error of mean (S.E.M). *Statistically significant when comparing craving between pre-stimulation vs. post-stimulation.

