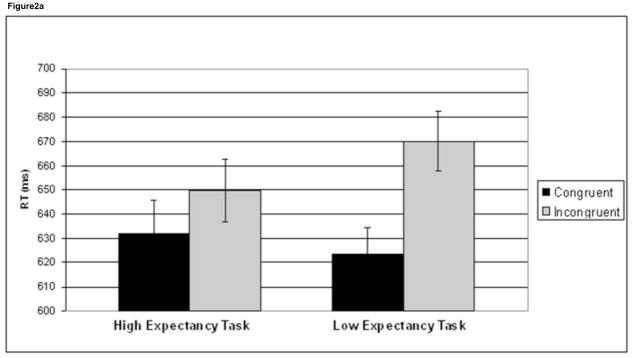
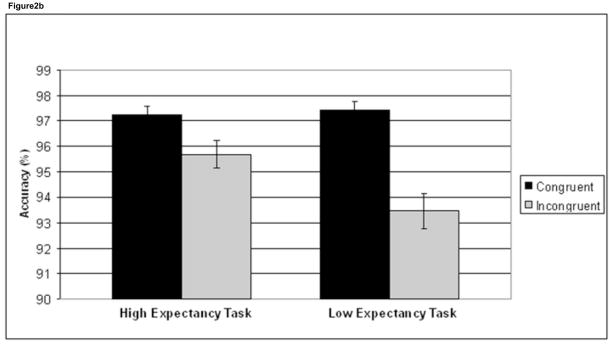
Figure 2.
Behavioral interference effects. Mean reaction time (RT) (a) and accuracy (%) (b) data are plotted for congruent trials (black) and incongruent trials (grey) in the high expectancy task and the low expectancy task. Incongruent trials are significantly slower and less accurate than congruent trials in both tasks. There was also a task × congruency interaction in both RT and accuracy, driven by greater interference effects in the low expectancy task. Error bars indicate standard error of the mean (SEM).


