
Fig. 3.
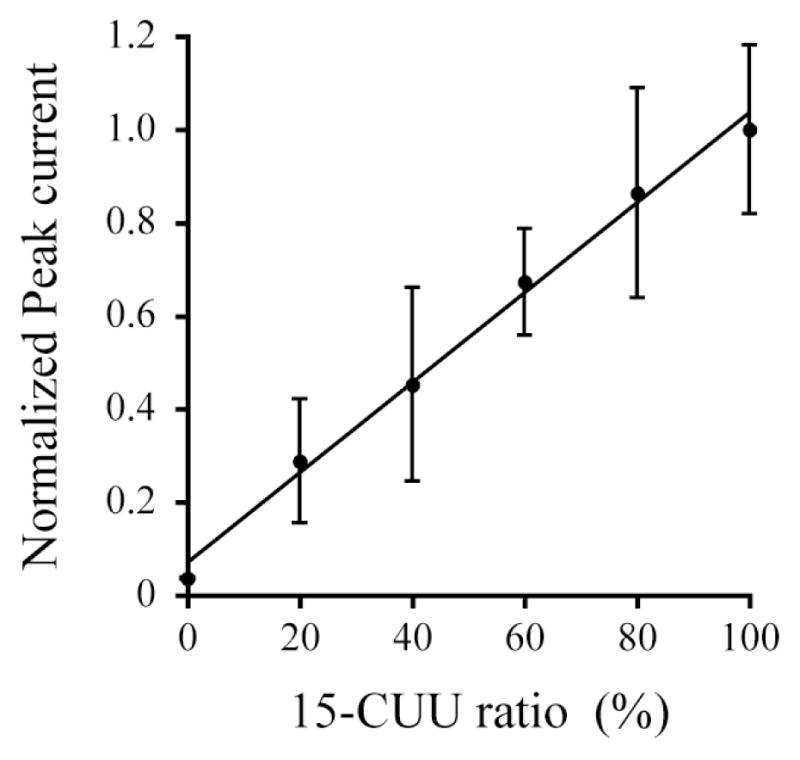
Relationship between the normalized peak current and the relative amount of target DNA. The peak current was measured using a probe DNA Fc-GAA with a mixture of 15-CCU and 15-CUU at a ratio of 100:0, 80:20, 60:40, 40:60, 20:80, and 0:100, respectively. The values denote the mean ± S.D. derived from five measurements.