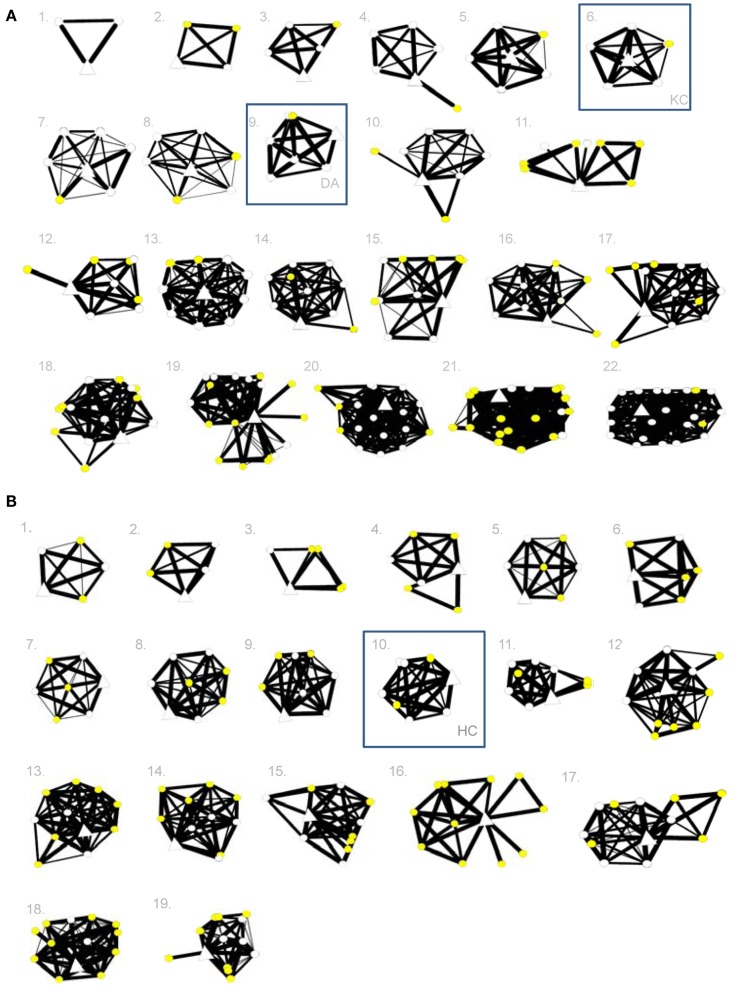
Figure 1.
(A,B) Social network maps for amnesic patients K.C. and D.A. (A) and H.C. (B) and their individual controls. In each person’s network, the open triangle represents the individual participant, open circles represent family members, and yellow circles represent friends. A higher degree of relationship “closeness” between two nodes is shown by a thicker line between them. Individuals’ maps are presented in ascending order from less dense to more dense social networks.

