
Figure 2.
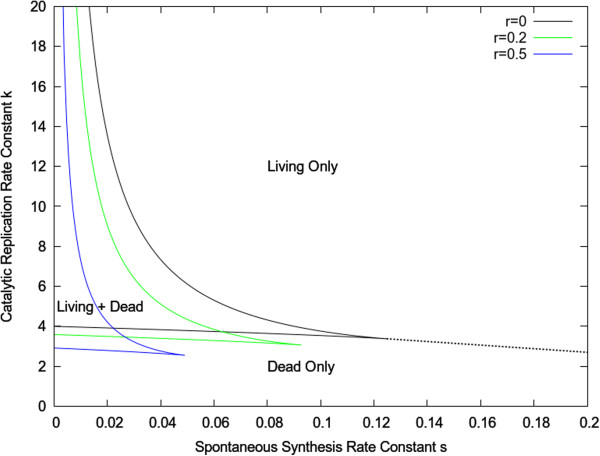
Phase diagram for the simple replicator model (Eqn. 5) as function of catalytic feedback efficiency k and spontaneous synthesis rate constant s with u= 1. Boundaries are shown for three different values of r.
Official websites use .gov
A
.gov website belongs to an official
government organization in the United States.
Secure .gov websites use HTTPS
A lock (
) or https:// means you've safely
connected to the .gov website. Share sensitive
information only on official, secure websites.
Phase diagram for the simple replicator model (Eqn. 5) as function of catalytic feedback efficiency k and spontaneous synthesis rate constant s with u= 1. Boundaries are shown for three different values of r.