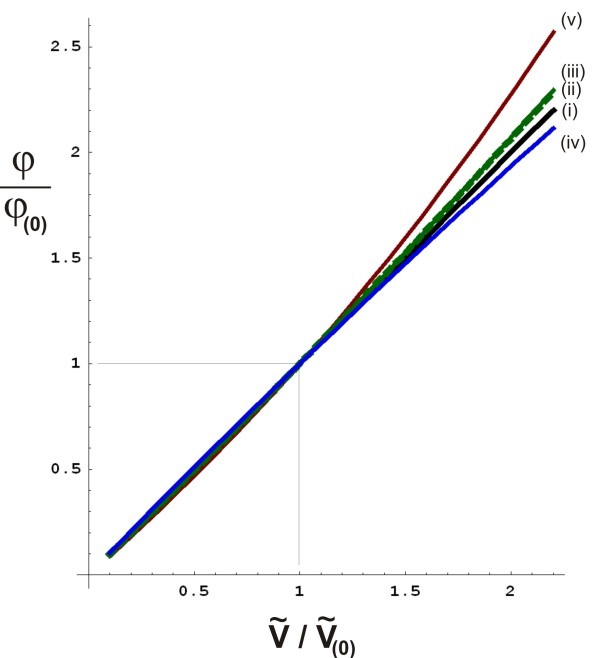
Figure 10.
Graphs indicating boundaries to the theoretically possible deviations from a linear relationship between relative volume change and relative voltage change (as indicated in assumption,eq.(16)), for various basic anatomical and cardiological features as listed in the appendix. In all graphs, the theoretical ratio φ/φ(0)(vertical axis, dimensionless number) has been calculated as function of the ratio (horizontal axis, dimensionless number), in which φ(0)is the given initial voltage change resulting from the known volume change as measured by the initial calibration procedure during n=0. In the ideal (and unrealistic) case that assumption would hold exactly, the relation would hold exactly as well, as represented by the identity line (thick continuous black line, indicated by (i)). The dotted green line, indicated by (ii), is a graph of eq. (34) with η=0.035, which is a second order calculation of the maximum deviation from linearity due to the presence of a boundary plane (representing the frontal surface between the conducting thorax and the insulating air) in the form of the frontal thoracic skin (feature (b) in the appendix, as depicted in Figure 9b), using the method of image charges [21]. The slender area between this dotted green line and the identity line (black solid line) represents the area containing all possible deviations from linearity (i.e., the solid black line) due to feature (b). Similarly, a graph was calculated for feature (b) using the entire perturbation series in eq.(31), resulting in the continuous green line, (iii). Furthermore, the continuous blue line (iv) represents the maximum deviation from linearity due to the non-spherical shape of the ventricles (feature (a)), using the entire perturbation series with η=−0.033. Finally, the maximum deviation from linearity due to the fact that (generally) the atria are filling up when the ventricles are emptying and vice versa (feature (c)), in combination with feature (b), results in the continuous red line (v), using the entire perturbation series and η=0.142.

