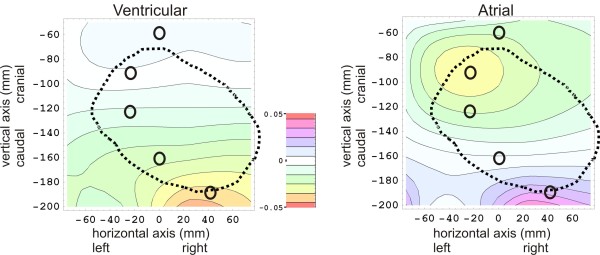
Figure 3.
Results of the ex-vivo post-mortem calibration measurements, showing a ventricular ’fingerprint’ plot at the left, an atrial ’fingerprint’ plot at the right, and a color scale legend in the middle. The horizontal and vertical axis in each plot represents the horizontal position x (in mm) and the vertical position z (in mm) on the thoracic skin, respectively, in which the origin (x=0 and z=0) coincides with the position of the top end of the sternal bone, near the incisura jugularis. In both fingerprint plots, the m(x,z)values are plotted as a color for each 2D position (x,z) on the thoracic skin. (See eqs. (13) and (14) for the definition of m(x,z)). The thick dotted black line in both plots denotes the contour of the heart lying below the thoracic skin. The positions of five electrodes (e1to e5)are indicated by black O-shaped symbols. In the plot on the left, the ventricular ’fingerprint’ is rendered, i.e. results are rendered of filling the ventricles with blood-equivalent solution, and simultaneously removing thorax-equivalent solution from the atria. In the plot on the right, the atria are filled with blood-equivalent solution, and thorax-equivalent solution is removed from the ventricles simultaneously.

