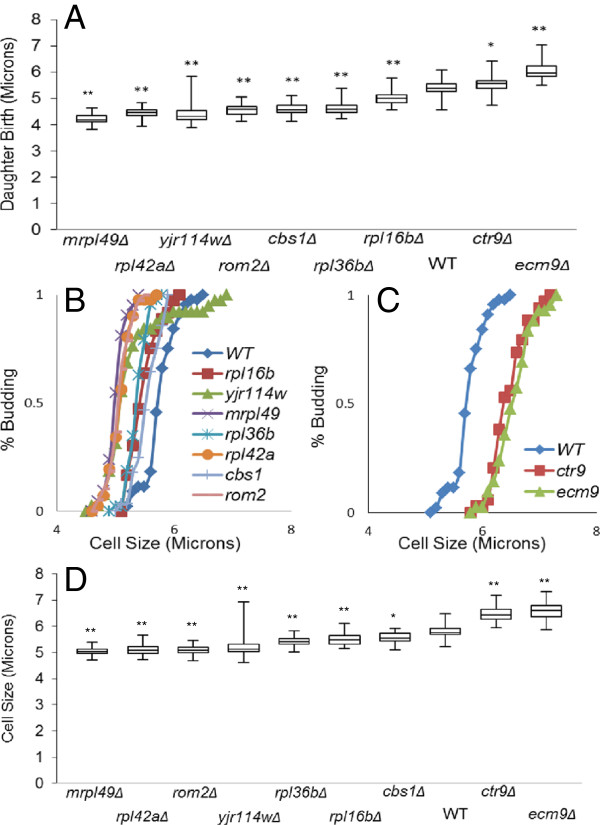
Figure 2.
Mutants alter birth size and “critical cell size” for daughters. (A) Box plot (refer Materials and Methods) represents the cell size distributions (in microns) at which daughter cells were born. Average size: whi mutants mrpl49Δ=4.2, rpl42aΔ=4.5, yjr114wΔ=4.5, rom2Δ=4.6, cbs1Δ=4.6, rpl36bΔ=4.6, rpl16bΔ=5, WT=5.4 and uge mutants ctr9Δ=5.5, ecm9Δ=6.1 (**p<0.0001, *p<0.05). (B) Plot represents % budded virgin daughters vs. cell size (microns): the whi mutants undergo division at an average “critical cell size” (defined by 50% budded) that is smaller than that of the wild type (mrpl49Δ= 5.0, rpl42aΔ= 5.1, rom2Δ= 5.1, yjr114wΔ=5.3, rpl36bΔ= 5.4, rpl16bΔ=5.5, cbs1Δ= 5.6, WT= 5.8). (C) Plot represents % budded virgin daughters vs. cell size (microns): large cell (uge) mutants undergo division at an average “critical cell size” larger than that of the wild type (WT= 5.8, ctr9Δ= 6.5, ecm9Δ= 6.6). (D) Box plot represents distributions (n=30-40) of daughter cell sizes at which they bud (**p<0.0001, * p=0.0008). Statistical differences were determined by Mann Whitney Test with p=0.05 as cutoff value.

