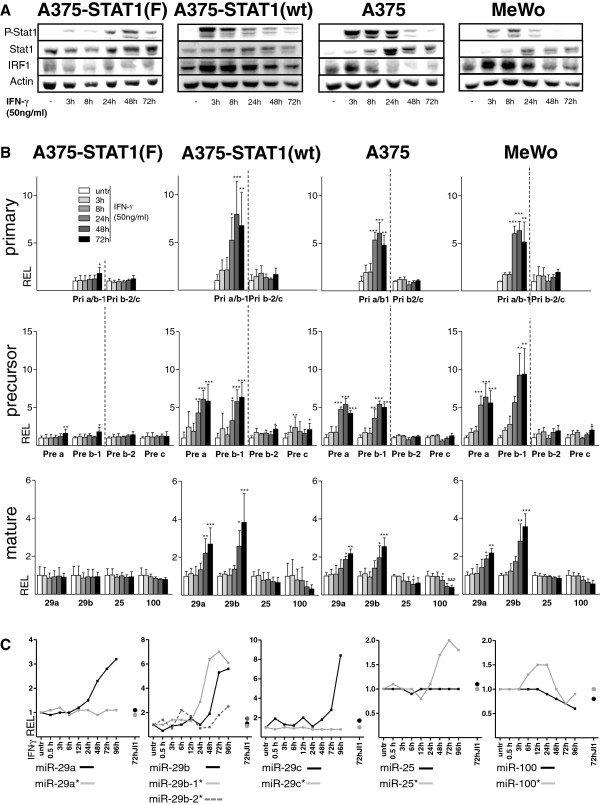
Figure 2.
Expression profiles of miR-29 clusters in melanoma cells. A375-STAT1(F), A375-STAT1(wt), A375 and MeWo melanoma cells were stimulated with IFN-γ for different time points. (A) Western Blot analysis (representative blots of biological triplicates) confirms activation of P-STAT1 and induction of STAT1 and IRF-1 after IFN-γ stimulation while dominant negative A375-STAT1(F) cells show minor effects. (B) Time course study of miRNA-expression after IFNγ-stimulation. Graphs show relative expression (REL) from quantitative qRT-PCR data for the pri-29a~b-1 and the pri-29b-2~c clusters, the precursors pre-29a/29b-1/29b-2/29c and mature miR-29a/29b/25/100. Fold expression was calculated relative to the untreated control and SDs are shown for biological triplicates. Statistical significance was tested with one-way ANOVA, followed by a Dunnett Post-Hoc test with * p<0.05, ** p<0.01 and *** p<0.001. (C) MiRNA and miRNA* expression profiles in A375 cells derived from a more detailed IFN-γ time course miRNA microarray experiment including cells treated with JI1 (IFN-γ stimulation for 72h after pre-treatment with JI1, black and grey dots). Depicted are log2-values of the mean of duplicate microarray experiments.

