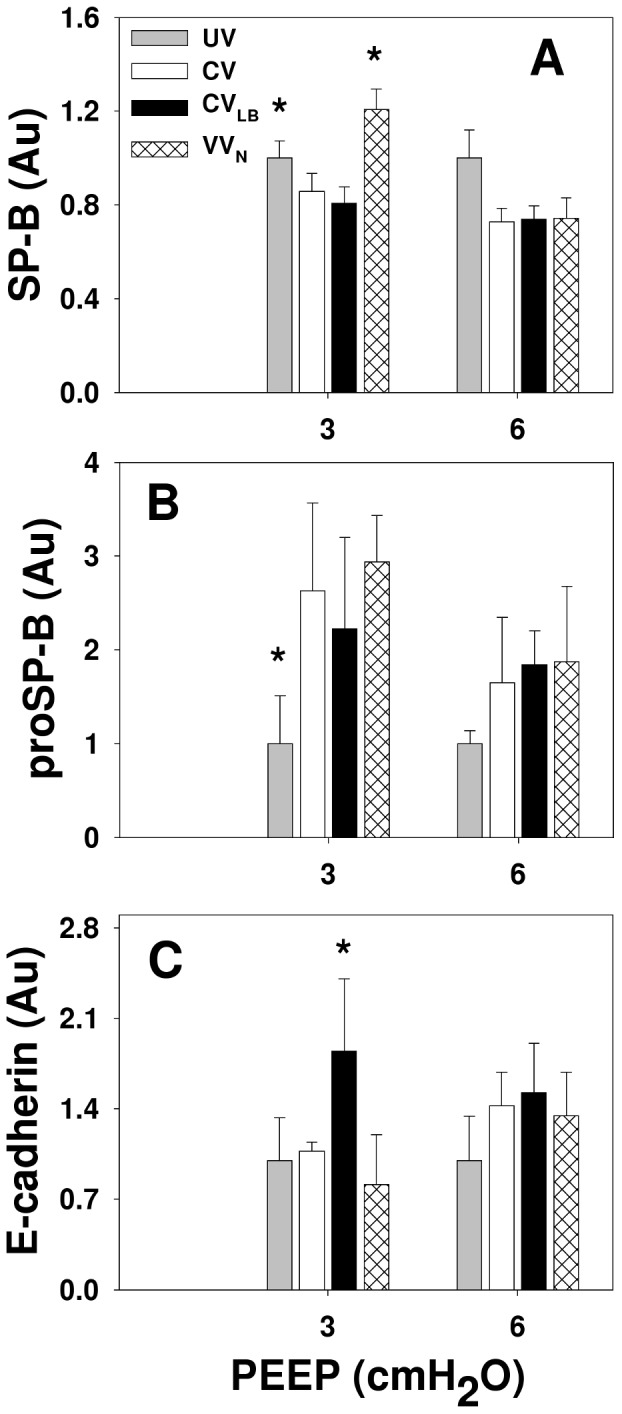
Figure 7. Analysis of Western blots.

Graphs show the relative amounts of SP-B, proSP-B and soluble E-cadherin in HCl-injured mice at the conclusion of 60 min of ventilation using CV, CVLB or VVN at PEEPs of 3 and 6 cmH2O. The data are normalized with the corresponding mean values of the unventilated group with baseline injury. The two bars in the unventilated group at the two PEEP levels correspond to samples from the same lungs on two separate Western blots. * denotes significant difference compared to CV (p<0.05).
