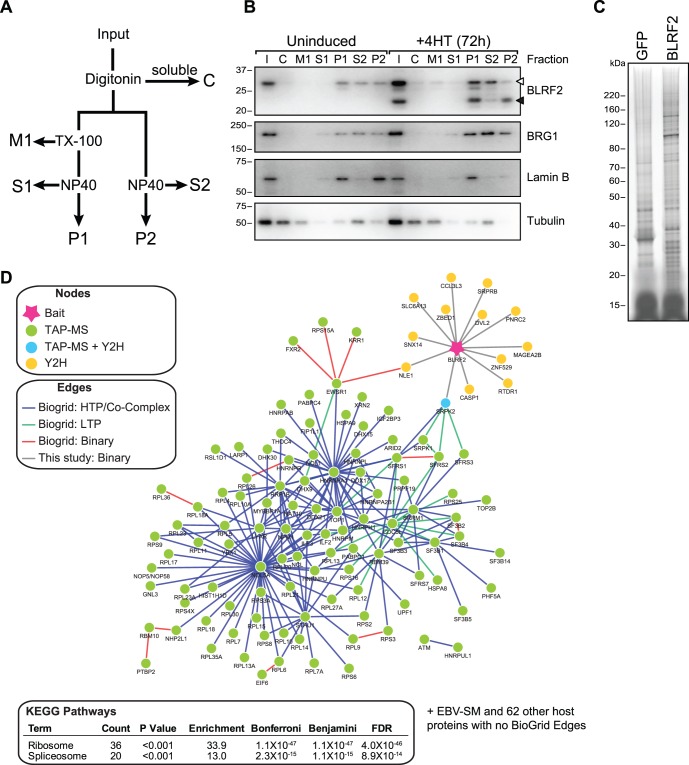
Figure 3. BLRF2 forms protein complex with SRPK2 and host RNA splice factors.
(A) Schematic of two fractionation procedures tested to extract BLRF2 complexes. The cytosol (C) was removed by Digitonin extraction and split between two procedures. Procedure 1 was a three step process in which the membrane and organelles (M1) were collected after Triton X-100 (TX-100) lysis, the soluble fraction after NP40 lysis (S1) and the remaining insoluble pellet (P1). Procedure 2 was only two steps in which the soluble fraction (S2) was collected after NP40 lysis and the remaining insoluble pellet (P2). (B) Western blot analysis of the fractions obtained using procedure described in (A). BLRF2 extraction was monitored using rabbit polyclonal anti-BLRF2 antibody. Endogenous BLRF2 is indicted with a filled arrowhead and FLAG-HA-BLRF2 with an open arrowhead. Fraction composition was also assessed by western blotting for control cell proteins BRG1 (nuclear and chromatin bound), lamin B (cytoskeleton) and tubulin (cytoplasmic). (C) Silver stain gel of 10% of the final elutions from a tandem affinity purification of FLAG-HA-GFP and FLAG-HA-BLRF2 stable P3HR1-ZHT cell lines. Molecular weights of size markers are shown (left). (D) Network representation of interacting proteins identified in TAP-MS and Y2H generated by Pathway Palette and the BioGrid database. EBV proteins are shown as stars and host proteins as circles. The bait (BLRF2) is shown in pink. Interacting proteins are colored based on the technology that identified them (TAP – green; Y2H – yellow; Both – blue). Edges are colored based on the type of evidence used to infer the interaction (Co-complex - blue edges; Binary – red). EBV protein interactions are all binary as described in the text and host-host interaction data is derived from the Biogrid database. Only the connected components are shown. The table shows enrichment of KEGG Pathways for proteins identified by TAP-MS.

