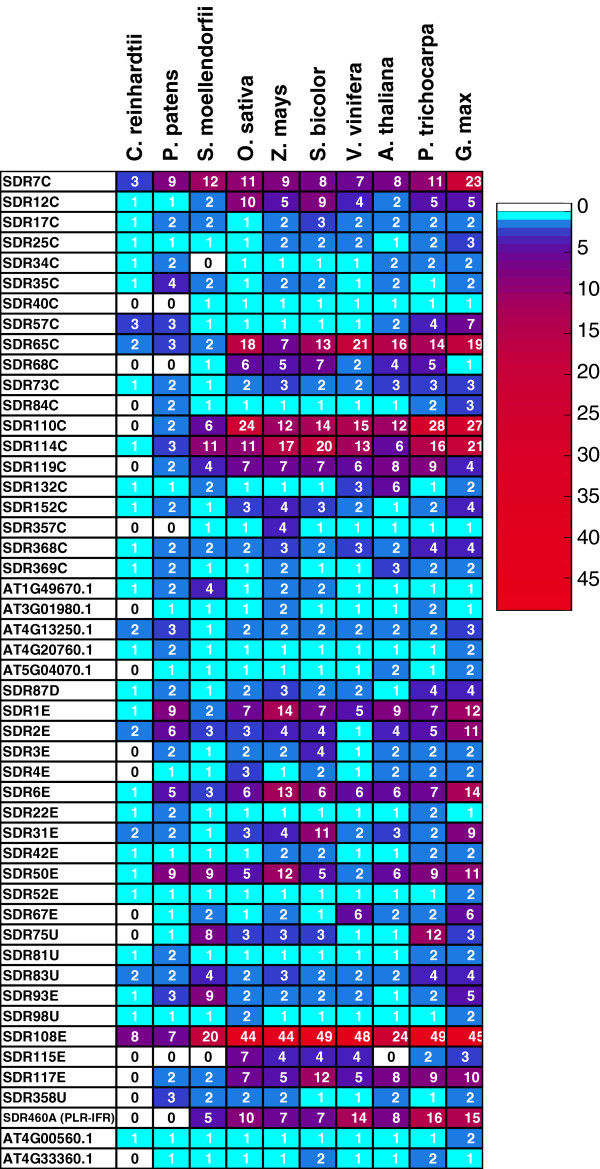
Figure 2.
Distribution of the SDR families in the analyzed plant genomes represented as a heat map. The heat map was built on a distribution matrix deduced from the inventory classification shown in Additional file 2: Table S2. The blue to red color gradient reflects the number of SDR listed in each family in the different genomes; the absence of family is indicated with a white square. The names of the families were deduced from the ‘SDR Nomenclature Initiative’ HMMs or by a representative gene accession for orphan families not recognized by a specific HMM.

