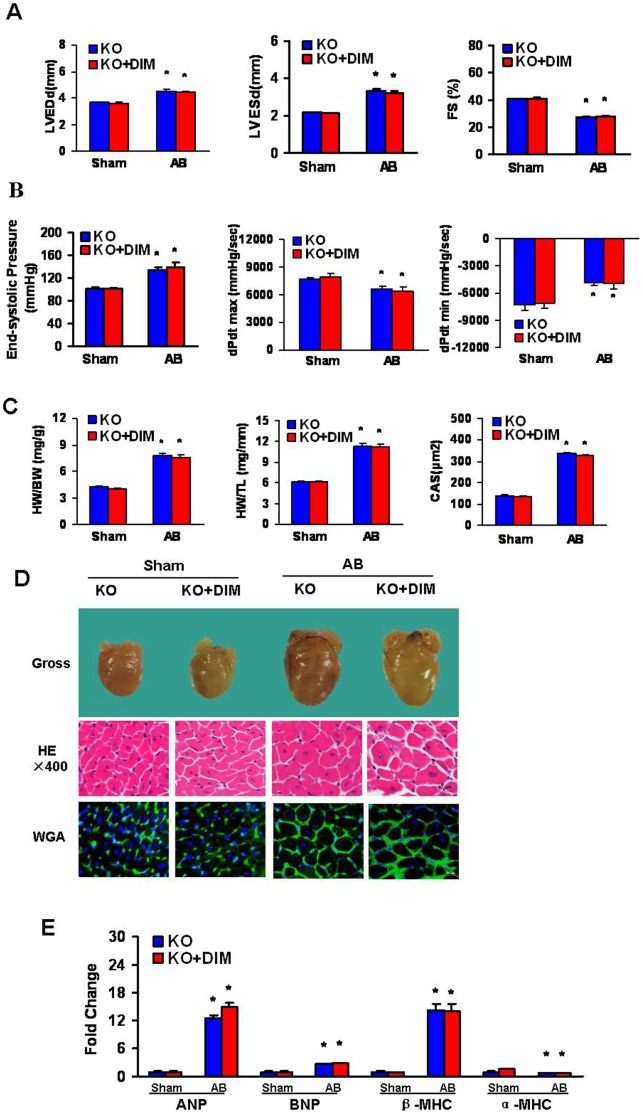
Figure 4. DIM inhibited cardiac hypertrophy by targeting AMPKα2.
(A and B) Echocardiography and pressure volume results from four groups of mice at 4 weeks after AB or sham surgery. (C) Statistical results of the HW/BW ratio, HW/TL ratio (n = 12) and myocyte cross-sectional areas (n = 100 cells per section) at 4 weeks after AB or sham surgery. (D) Histology: representative gross hearts (top), H&E staining (middle) and WGA–FITC staining (bottom). (E) Real-time PCR analysis of hypertrophic markers including ANP, BNP, α-MHC and β-MHC, from hearts of mice in the indicated groups (n = 6). Values are expressed as mean±SEM. *P<0.05 compared with the corresponding sham group. # P<0.05 vs KO+AB group.

