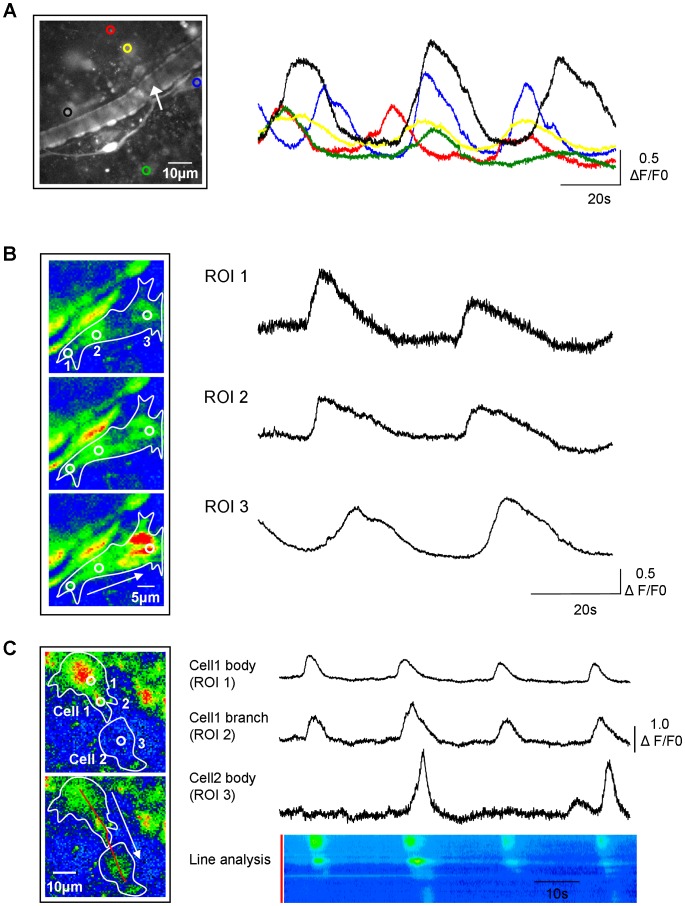
Figure 2. Networked signalling in ICC-LP. A.
Low-magnification field of view showing multiple ICC-LP within the tissue and an intensity-time plot of activity in the ICC-LP network indicated by the coloured regions of interest. A typical mucosal microvessel is present in the middle of the micrograph (arrow). B. The cell indicated by the blue region of interest in panel A, is shown at higher magnification. Three regions of interest (ROI) indicate the tip and middle of a branch and the cell body and the micrographs show the direction of travel of the Ca2+-event from the tip of the branch (ROI 1) through the length of the branch (ROI 2) to the cell body (ROI 3) as indicated by the white arrow. Intensity-time plots for ROI 1–3 show signals travelling within the ICC-LP for 80 s from the tip of the branch to the cell body. C. Images of activity in 2 adjacent ICC-LPs showing spread of the signal from the body of cell 1 (ROI 1), along a branch (ROI 2), to the body of cell 2 (ROI 3). Intensity-time plots show that transmission from cell 1 to cell 2 was not always successful (occurring 2 out of 4 times in the example shown). This recording is also illustrated as a post-hoc x-t line analysis where the fluorescence intensity along the red line along cell 1 and cell 2 is plotted against time.

