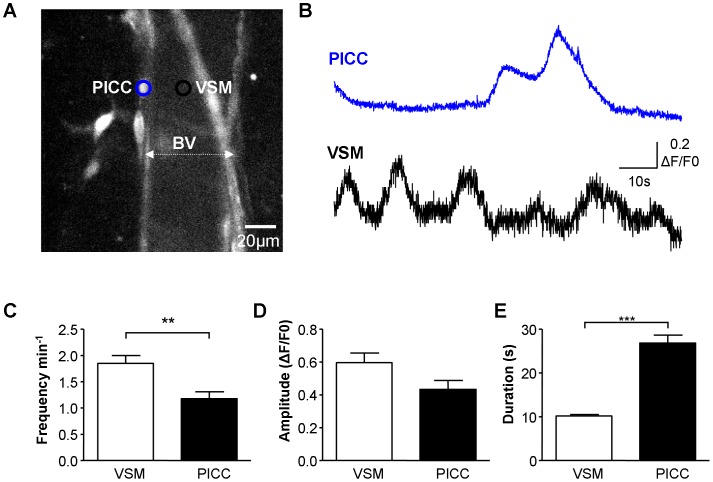
Figure 7. Ca2+-oscillations in PICC and VSM. A.
Micrograph of a mucosal microvessel shown by dotted white line, and associated perivascular ICC (PICC). B. Intensity-time plot of Ca2+-activity in the vascular smooth muscle cell (VSM; black region of interest) and associated PICC (blue region of interest) from A. Both cell types showed spontaneous Ca2+-activity which was apparently not correlated. C–E. Summary data showing significant differences in the frequency and duration of spontaneous Ca2+-activity between the two cell types (45 VSM and 21 PICC). PICC had less frequent, longer duration, similar amplitude events in comparison to VSM.

