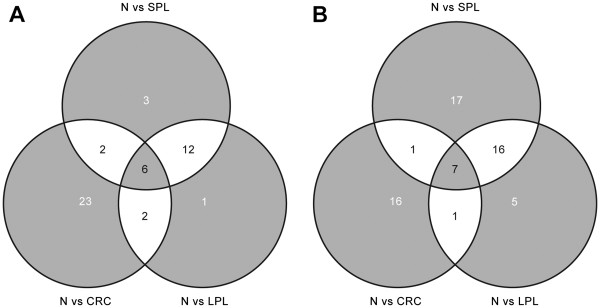
Figure 1.
Numbers of pathways displaying tumor-associated dysregulation at one or more stages of colorectal tumorigenesis. Venn diagrams show the numbers of pathways that were significantly dysregulated―i.e., upregulated (A) or downregulated (B) with respect to findings in normal mucosa (N)―in small precancerous lesions (SPLs), large precancerous lesions (LPLs), and colorectal carcinomas (CRCs).

