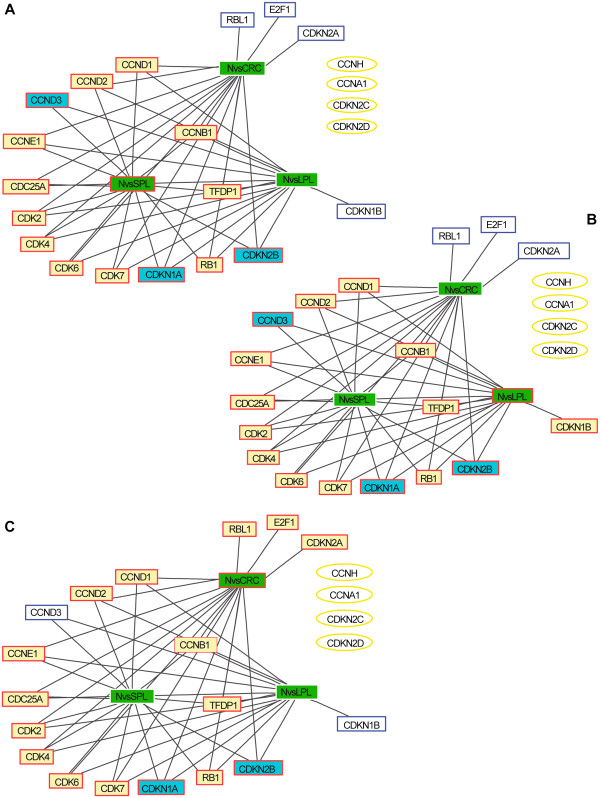
Figure 3.
Dysregulation of the cell cycle pathway during tumor progression. Expression levels for the 22 Biocarta cell cycle genes in each tumor stage-specific data subset―SPLs (A), LPLs (B), and CRCs (C)―were compared with those in the normal mucosa (N) data set using two-sample t-test. Each graph contains 22 nodes representing the genes in the pathway (white, yellow, and blue rectangles, and yellow ellipses) plus a node for each tumor-stage being analyzed (green rectangles; those outlined in red represent the stage considered in the panel). Yellow and blue rectangles: genes displaying tumor-associated upregulation or downregulation, respectively, in the stage represented in the panel; white rectangles: genes that were also dysregulated in at least one of the other two stages; yellow ellipses: cell-cycle genes that displayed no tumor-related dysregulation at any of the three stages. The connection matrix used for the graph was a sparse square matrix of order 25 where 1 indicates connection between nodes and 0 indicates no connection. Black lines: connection between a gene node and tumor-stage node (i.e., tumor-related up- or downregulation of the gene at that stage).

