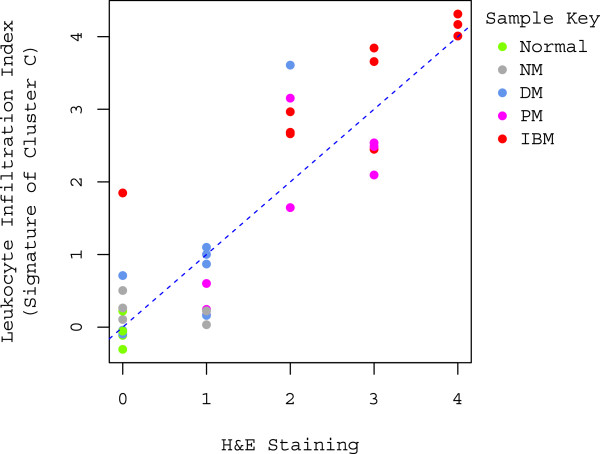
Figure 3.
Correlation between leukocyte infiltration index and H&E staining. A significant linear correlation is displayed in the scatter plot between the leukocyte infiltration index and the degree of inflammation assessed by H&E staining (0=no inflammation, 1=sparse inflammation, 2=mild inflammation, 3=moderate inflammation, and 4=severe inflammation). Data points are colored by the sample type; color key is displayed in the upper right corner of the plot. The regression line is denoted by the blue dotted line (intercept=0.07, slope=1.00; R2=0.79, p<0.001).

