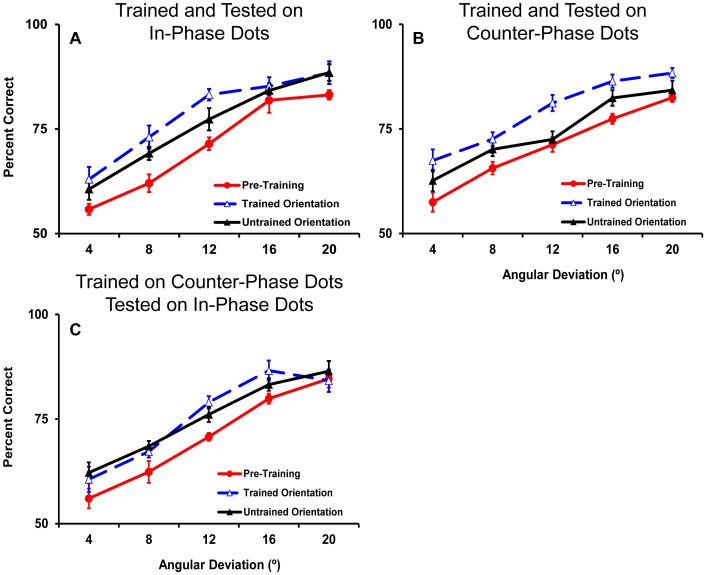
Figure 4. Average pre and post training psychometric functions for participants trained on in-phase dots (n = 7) (A) and counter- phase dots (B) (n = 11).
A subset of 5 participants trained on counter- phase dots also completed psychometric functions for in- phase dots pre and post training. These data are shown in panel C. For each set of functions pre training data are collapsed across the two motion axis orientations as they did not differ. Error bars show within subjects standard error of the mean [53], [54] in this figure and all subsequent figures that represent within subject effects.

