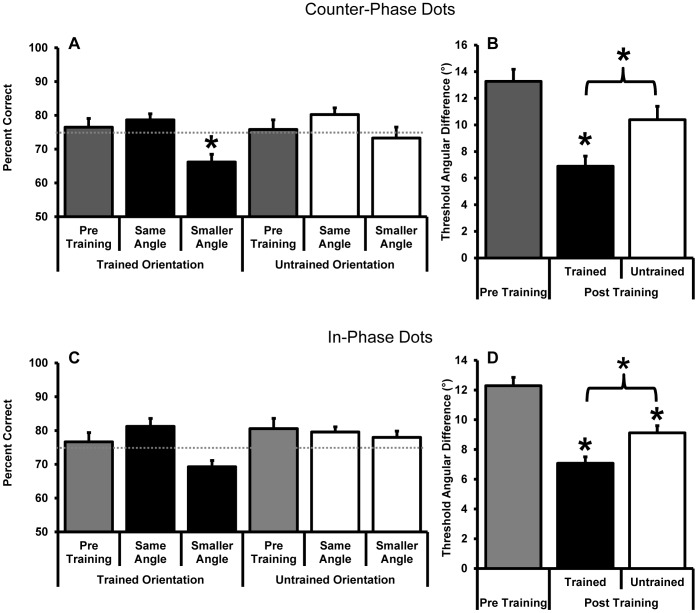
Figure 6. Behavioural accuracy during scanning (A and C) and the average angular threshold that gave rise to 75% correct accuracy outside of the magnet (B and D) for the group of participants trained on counter-phase dot stimuli (n = 9) (A and B) and those trained on in-phase dot stimuli (n = 7) (C and D).
Data are shown for measurements made pre and post training. Post training stimuli were presented either at the same angular size shown pre training (“same angles” in panels A and C which correspond to pre-training measurements in panels B and D) or at the 75% correct angular threshold as measured outside of the magnet post training (“smaller angles” in A and C which correspond to the post training measurements in panels B and D). The dashed grey lines in A and C indicate 75% correct behavioural accuracy. Asterisks indicate a significant difference from pre training data unless otherwise indicated by a bracket (paired samples t-tests, p<0.05).

