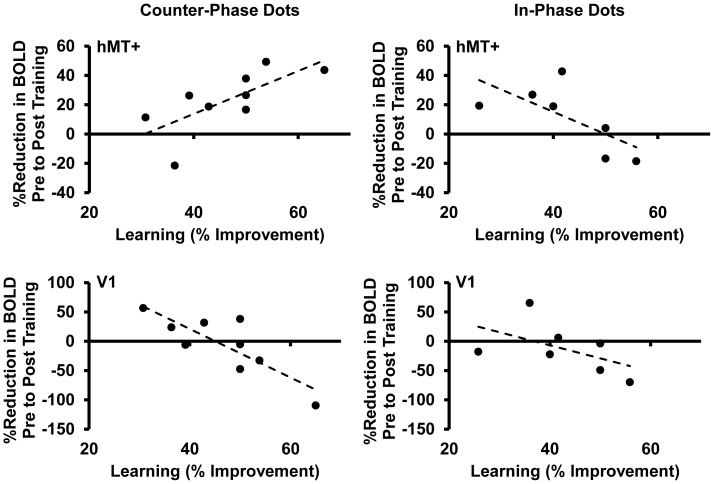
Figure 9. The relationship between the change in BOLD response and the amount of learning.
The percent reduction in BOLD response pre to post training for the trained motion axis is shown on the Y axis and the percent improvement in 75% correct threshold a result of learning is shown on the X axis. Each data point represents an individual participant. Data are shown for hMT+ (top row) and V1 (bottom row) for counter-phase dots (left column) and in-phase dots (right column). Post training data are collapsed across angle size (“same and “smaller” angles).

