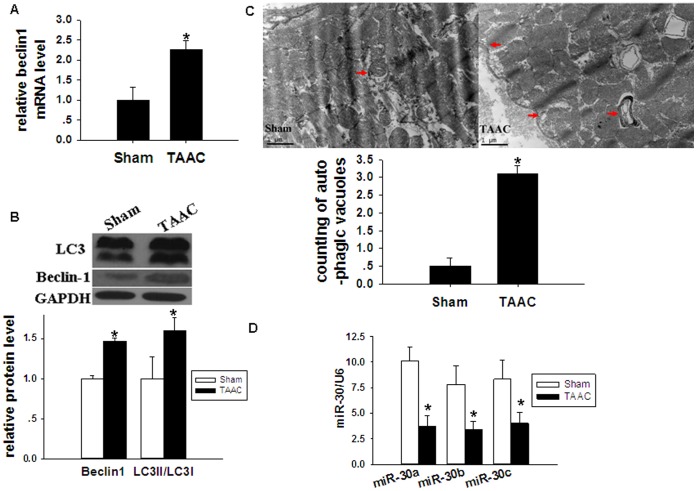
Figure 3. Autophagy and miR-30 expression in rats after TAAC surgery.
The relative expression of mRNA level, microRNA level, protein, and autophagic vacuoles in left ventricular tissues from Sham and TAAC rats was analyzed 4 weeks after the operation. (A) Relative mRNA expression level of beclin-1 was analyzed by qRT-PCR. 18S was used as an internal control. (B) Relative expression of autophagy-related proteins, beclin-1 and LC3, was analyzed by Western blotting. GAPDH was used as an internal control. (C) Autophagic vacuoles (arrows indicated) were detected by transmission electron microscopy, at a magnification of ×13500. Scale bar: 1 µm. (D) Relative miR-30a, miR-30b and miR-30c expression which was presented as 2−Δct*10−3 was analyzed by qRT-PCR. U6 was used as an internal control. Data are presented as means ± SEM. *P<0.05 compared with Sham.

