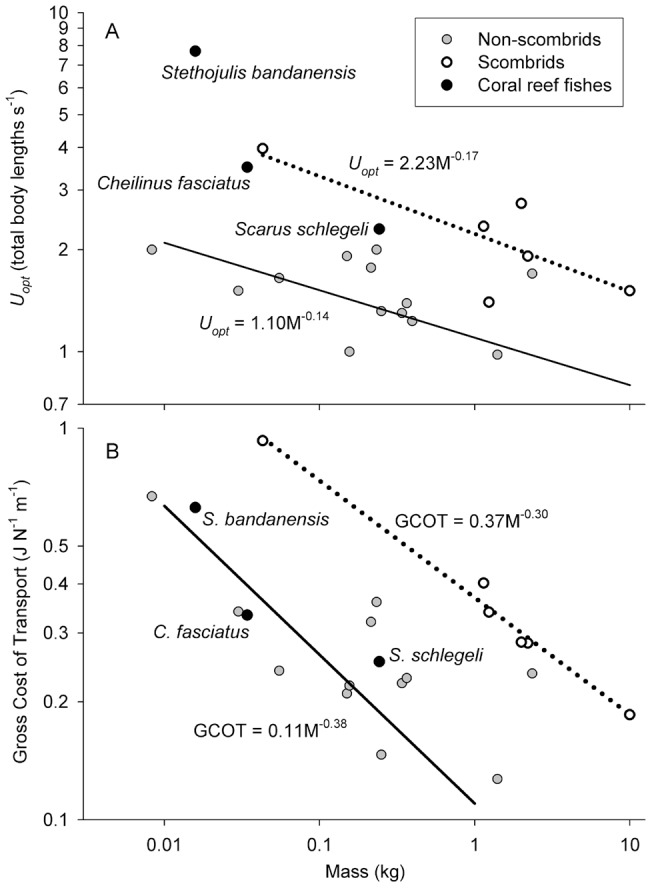
Figure 3. Comparative energetic swimming performance of bony fishes.

Three coral reef and sixteen other non-scombrid fishes are presented alongside six scombrid (tuna-like) fishes of varying body mass on log-log plots of (A) Optimum swimming speed (Uopt) and (B) Gross cost of transport (GCOT) incurred by each species at their optimum swimming speed (Uopt). Dotted and solid lines denote mass-Uopt and mass-GCOT power functions [after 3, 6] for scombrid and non-scombrid fishes, respectively (note the range of temperatures encompassed within the underlying data in Table S1 [5], [8], [22]–[24], [26]–[32], which reflect the conditions experienced by each species performing in the wild). Note S. bandanensis is well above the scombrid Uopt trend (A, dotted line), but has the same (much lower) GCOT as similar-sized non-scombrid fishes swimming four times slower (B, solid line).
