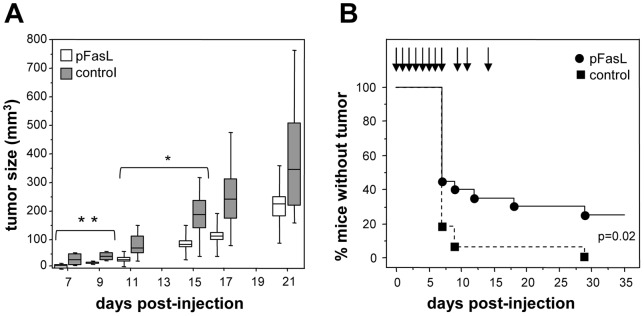
Figure 4. Anti-tumor activity of pFasL.
Panel A: Tumor growth in mice having received subcutaneously 105 A431 cells at day 0, and 0.1 mL of concentrated pFasL (white boxes) or pFasL-free control (grey boxes) locally at days 2 and 7 (n = 6 mice per group). Tumor volumes are expressed in mm3. Values are presented as median, 25th and 75th percentiles (horizontal line, bottom and top of boxes), and 10th and 90th percentiles (bottom and top range bars) (**p = 0.04, * p = 0.05). Panel B: Kaplan-Meier analysis of cumulative percentage of mice without detectable tumor,, xenografted with A431 cells and treated with pFasL (black circles) or pFasL-free control (black squares) (p = 0.02). n = 20 mice per group, from two experiments pooled.

