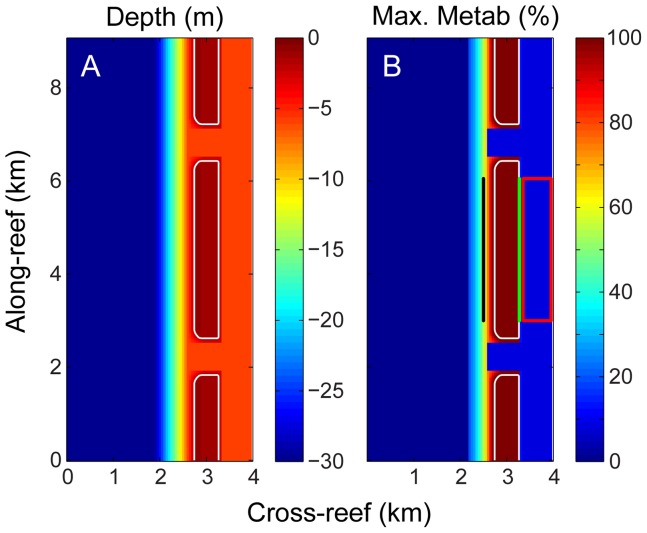
Figure 2. Bathymetry and benthic metabolism for the central model case.
(A) Bathymetry and (B) rate of hourly metabolism (p, r, g net) as a percentage of the maximum rate for the entire reef system. In panel B the forereef and backreef transects defined in later analyses are indicated by the heavy black and green lines, respectively; while the lagoon zone defined in later analyses is indicated by the red box. The values shown along the x and y axes are only to illustrate the scale of the model domain.

