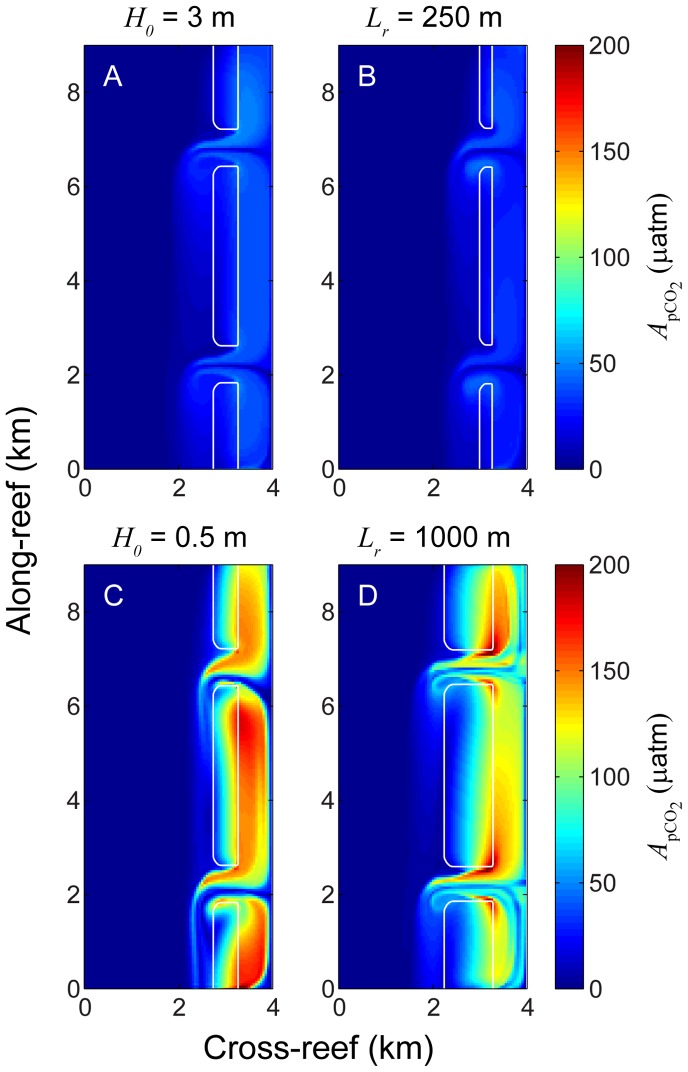
Figure 7. Weak and strong variation in pCO2.
Amplitude of diurnal pCO2 variation  for simulations based on the following variations in offshore wave height and reef flat length: A) H
0 = 3 m, B) L
r = 250 m, C) H
0 = 0.5 m, and D) L
r = 1000 m. Simulations shown in A and B represent conditions resulting in relatively weak variations in carbonate chemistry while simulations C and D represent conditions resulting in relatively strong variations in carbonate chemistry.

