
Figure 8. Changes in pCO2 on the forereef and lagoon versus the backreef.
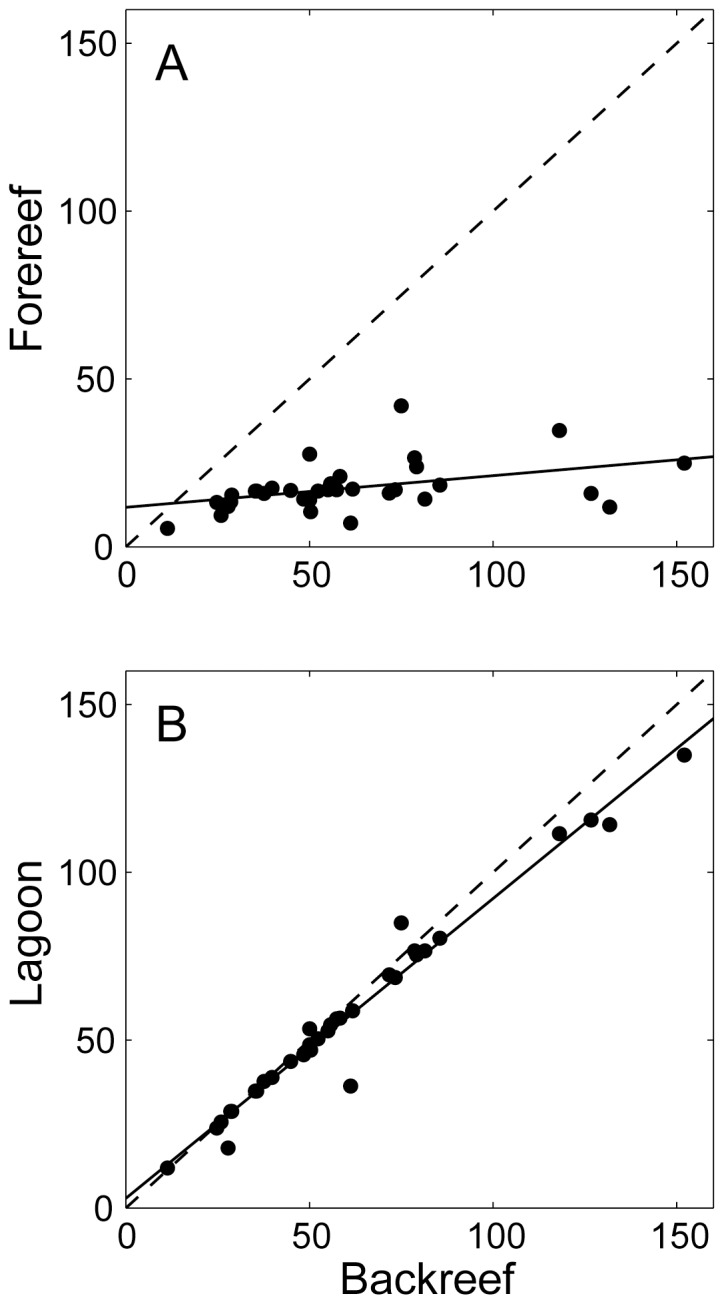
Amplitude of diurnal pCO2 variation  A) at the forereef and B) in the lagoon versus the backreef. The solid lines represent best-fit linear regressions in the form of A) y = 0.09x+12, r
2 = 0.18 and B) y = 0.89x+2.9, r
2 = 0.97 where n = 33 for both plots. The dashed lines represent 1∶1 relationships.
A) at the forereef and B) in the lagoon versus the backreef. The solid lines represent best-fit linear regressions in the form of A) y = 0.09x+12, r
2 = 0.18 and B) y = 0.89x+2.9, r
2 = 0.97 where n = 33 for both plots. The dashed lines represent 1∶1 relationships.