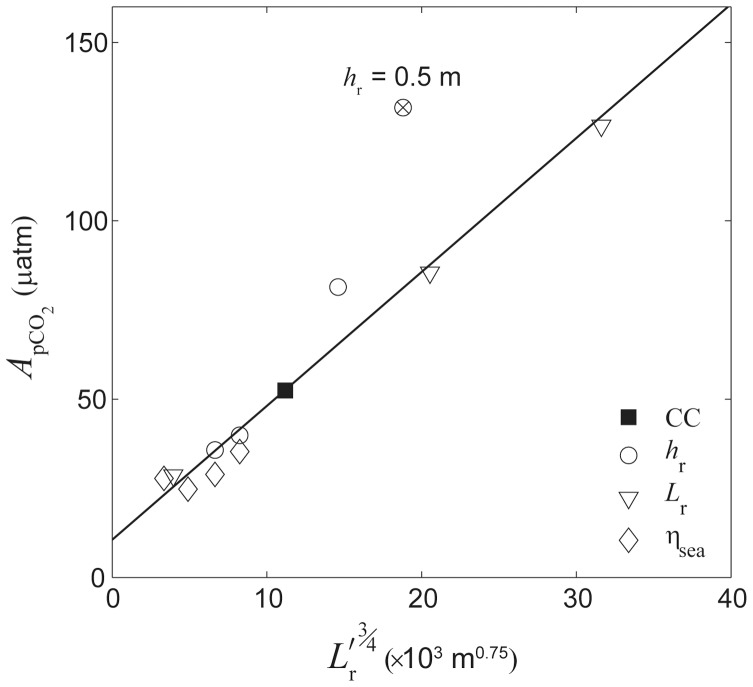
Figure 10. Effect of reef flat geometry.
Amplitude of diurnal pCO2 variation  at the backreef versus
  based on simulations varying reef flat depth, reef flat width, and sea level. All other variables not listed in the legend were equal to those of the central case (‘CC’). The solid line represents the best-fit linear regression in the form of y = 3.8x+10.6, r
2 = 0.96, n = 11. The circle with the cross represents the shallowest reef flat simulation (
 = 0.5 m) and was not included in the regression.

