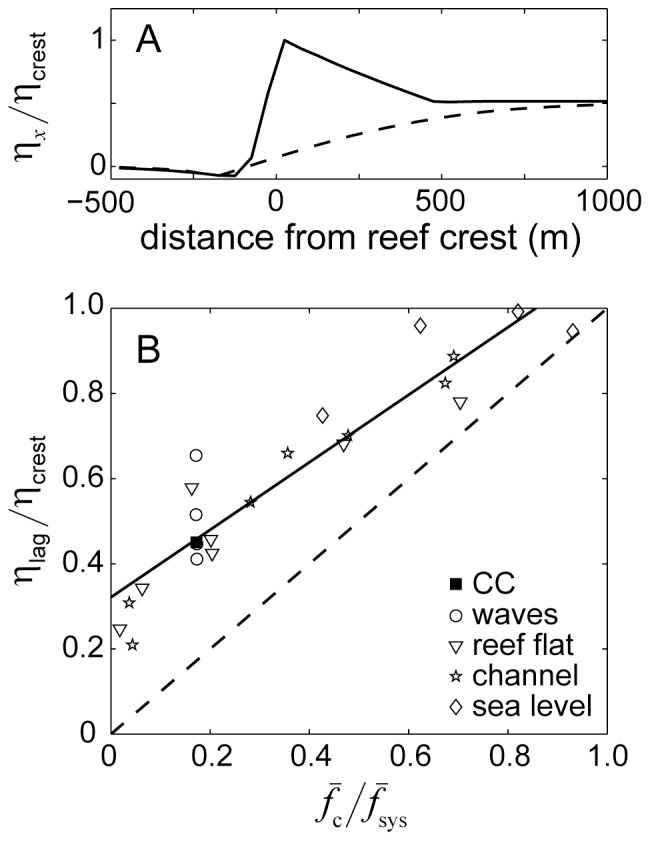
Figure 13. Ratio of wave setup versus ratio of system friction.

A) profiles of normalized wave-driven setup across the reef flat (solid line) and channel (dashed line). B) The ratio of lagoon to reef-crest setup versus the ratio of the channel friction coefficient to the total system friction coefficient for simulations testing variation in offshore wave heights, reef flat geometry, channel geometry, and sea level. The solid line represents best-fit regression of the form of y = 0.8x+0.32 (r 2 = 0.87, n = 23). The dashed line represents a 1∶1 relationship.
