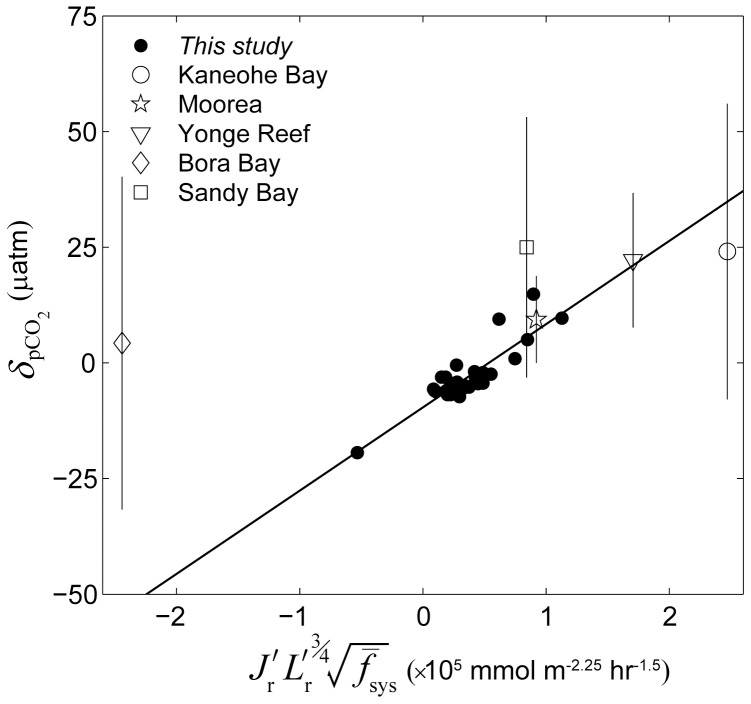
Figure 15. Combined effect of all factors on the net offset in pCO2.
Difference between the pCO2 of backreef waters and offshore waters averaged over a 24-hour period  versus the combined influence of wave forcing, sea level, metabolism, reef flat geometry, and system frictional resistance for all 33 simulations (dark circles, see Eq. 7 and Eq. 8). For all data shown,
  was calculated assuming
  (see Eq. 20). The solid line represents a best-fit linear regression of the simulations in the form of y = 18x–9.6 (MSE = 3 µatm, r
2 = 0.76, n = 33). Also shown are the average offsets in the pCO2 of reef waters relative to offshore waters observed in real reef systems [24], [25], [56], [57] normalized to a temperature of 25°C (see Eq. 21) for which there was enough supporting hydrodynamic and biogeochemical data (see Tables 2 and 3; the vertical lines represent ±1 std. dev.). The best-fit regression for the observed
  versus the x-axis term is y = 4x+14 (MSE = 7 µatm, r
2 = 0.64, p<0.06, n = 5, not shown).

