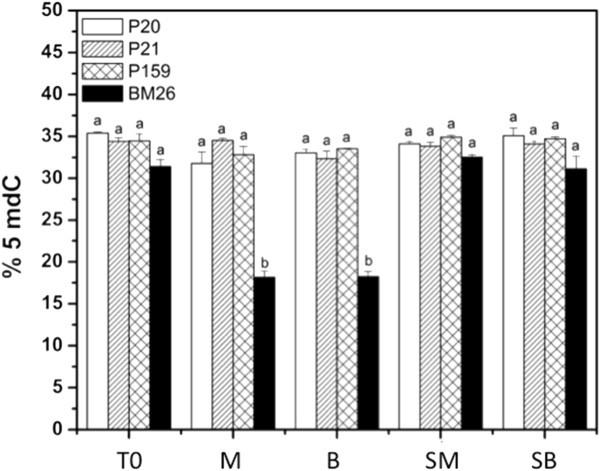
Figure 3.

Methylation quantification in genomic DNA from Agave fourcroydes clones P20, P21 and P159 and A. angustifolia clone BM26. Plantlets from multiplication medium (T0), semisolid growth medium in Magenta boxes (M), temporary immersion in modular Bioreactors (B), soil previously cultured in M (SM) and soil previously cultured in B (SB) were used for the analysis. Each bar corresponds to the mean with its standard error (n = 15). Different letters in columns represent the statistical significance of mean differences at a given time by the Tukey test (P ≤ 0.01).
