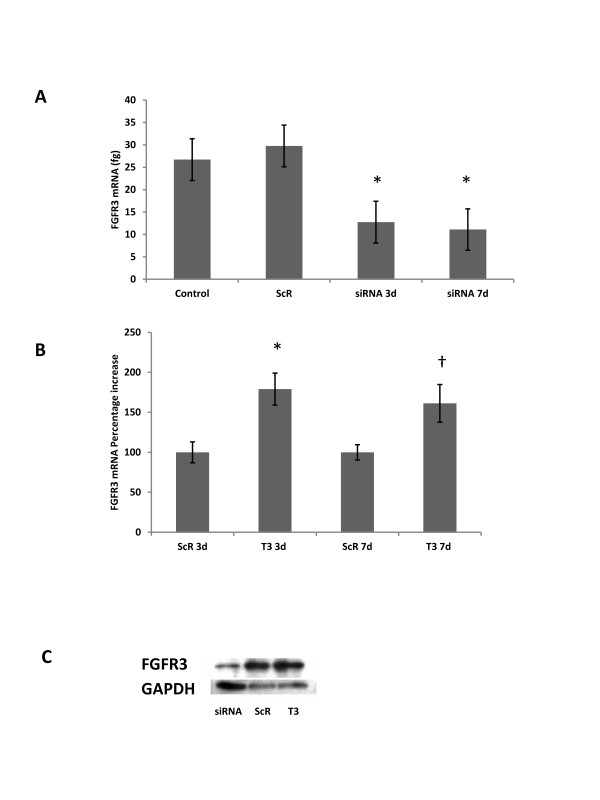
Figure 1.
FGFR3 siRNA and T3 effects on FGFR3 mRNA and protein.A) FGFR3 mRNA (femtogram) at 3 (siRNA 3d) and 7 (siRNA 7d) days post siRNA transfection; B) FGFR3 mRNA as a percentage of untreated control cells in response to T3 treatment at 3 and 7 days post exposure. Data are presented as mean ± SEM. An asterisk (*) denotes means differed from control at p < 0.05; † denotes means differed from control at p < 0.1. C) FGFR3 protein levels at 3 days post siRNA transfection for FGFR3 siRNA (lane 1), ScR control treated chondrocytes (lane 2), and T3 treated chondrocytes. The blot image is representative of the replicate blots performed and greater amounts of protein were loaded for the FGFR3 siRNA lane to ensure detectable signal.

