
Figure 7.
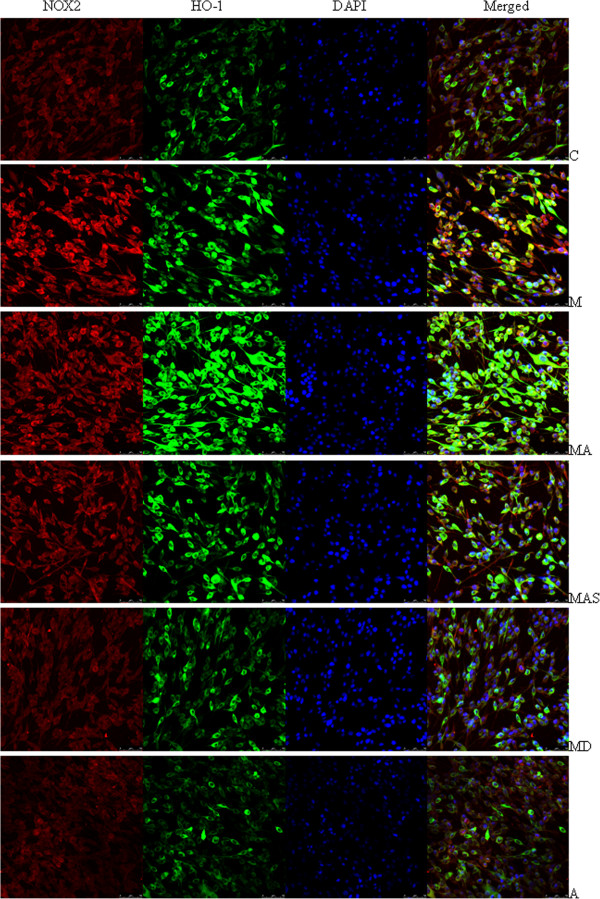
The subcellular localization and expression of HO-1 and NOX2 following administration of MPP+ and ATX. The groups are C: Control; M: MPP+ (500 μM); M+A: MPP+ (500 μM) plus ATX (10 μM); MAS: MPP+ (500 μM) plus ATX (10 μM) and SnPPIX (10 μM); MD: MPP+ (500 μM) plus DPI (1 μM), A: ATX (10 μM). Confocal microscopic images of the subcellular localization and expression of HO-1 and NOX2. After administration of MPP+ and other reagents to PC12 cells, NOX2 (Alexa Fluor 594, red fluorescence), HO-1 (Alexa Fluor 488, green fluorescence), and nuclei counterstained with DAPI (blue) are shown.