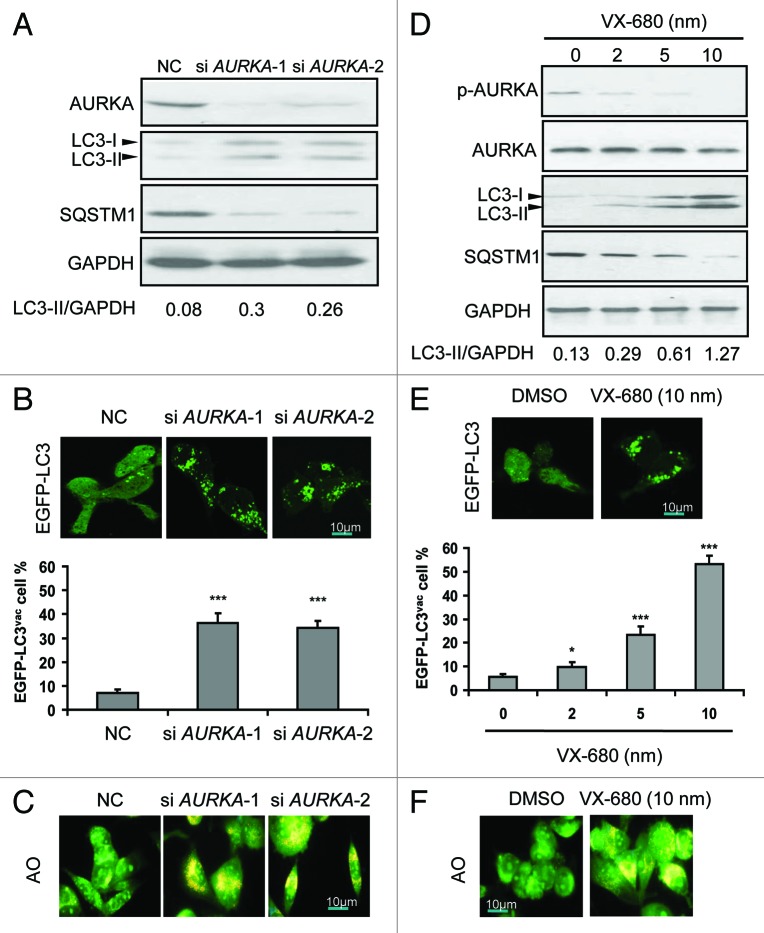
Figure 3. Depletion or inhibition of AURKA induced autophagy. (A) BT-549 cells were treated with 100 nM AURKA-1 siRNA (si AURKA-1), AURKA-2 siRNA (si AURKA-2) and NC siRNA for 24 h respectively, and then cell lysates were subjected to western blot analysis with the indicated antibodies. LC3-II and GAPDH were quantified using Image J software. (B) BT-549 cells were transfected with 2 μg of EGFP-LC3 construct. At 24 h post-transfection, cells were transfected with AURKA-1 and AURKA-2 siRNA (100 nM). After additional 24 h post-transfection, the localization of LC3 in transfected cells was examined by confocal microscopy (magnification × 1000). The percentage of cells showing accumulation of EGFP-LC3 in puncta (EGFP-LC3vac) was quantified. A minimum of 100 EGFP-LC3-transfected cells were counted. Results are the mean ± SD of triplicates. ***p < 0.001, compared with controls. (C) BT-549 cells were treated with 100 nM AURKA-1 siRNA, AURKA-2 siRNA and NC siRNA for 24 h respectively. Cells were stained with acridine orange (AO) and examined by fluorescence microscopy (magnification × 400). Large orange puncta were considered to be acidic vesicular organelles (AVOs). (D) BT-549 cells were treated with increasing doses of VX-680 for 24 h, and then cell lysates were subjected to western blot analysis with the indicated antibodies. LC3-II and GAPDH were quantified using Image J software. (E) BT-549 cells were transfected with EGFP-LC3. At 24 h post-transfection, cells were treated with increasing doses of VX-680 for 24 h. Localization of LC3 in transfected cells was examined by confocal microscopy (magnification × 1000), the percentage of cells showing accumulation of EGFP-LC3 in puncta (EGFP-LC3vac) was quantified. A minimum of 100 EGFP-LC3-transfected cells were counted. Results are the mean ± SD of triplicates. *p < 0.05; ***p < 0.001, compared with control. (F) BT-549 cells were treated with 10 nM VX-680 for 24 h. Cells were stained with acridine orange (AO) and examined by fluorescence microscopy (magnification × 400). Large orange puncta were considered to be acidic vesicular organelles (AVOs).

An official website of the United States government
Here's how you know
Official websites use .gov
A
.gov website belongs to an official
government organization in the United States.
Secure .gov websites use HTTPS
A lock (
) or https:// means you've safely
connected to the .gov website. Share sensitive
information only on official, secure websites.
