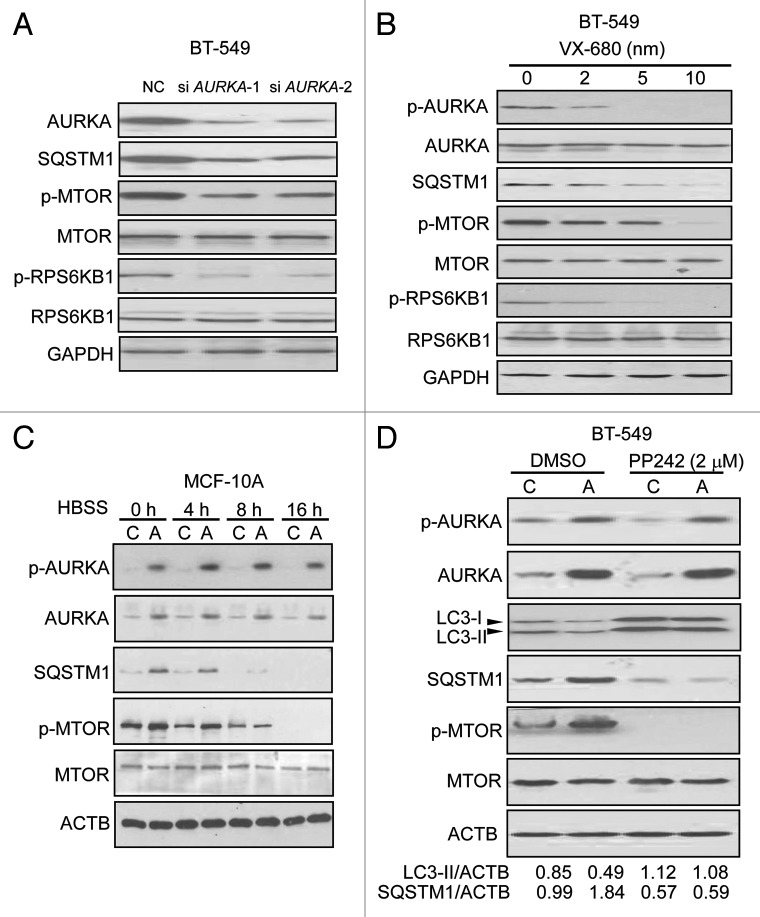
Figure 5. AURKA-suppressed autophagy was associated with MTOR activation. (A) BT-549 cells were treated with 100 nM AURKA-1 siRNA, AURKA-2 siRNA and NC siRNA for 24 h respectively, and then cell lysates were analyzed by western blot. (B) BT-549 cells were treated with increasing dose of VX-680 for 24 h, and then cell lysates were subjected to western blot analysis. (C) Control (C) and overexpressed AURKA (A) MCF-10A cells were subjected to HBSS starvation for the indicated time intervals. Cell lysates were subjected to western blot asssays similarly. (D) Control (C) and overexpressed AURKA (A) BT-549 cells were treated with DMSO and 2 μM PP242 for 24 h, and then cell lysates were subjected to western blot analysis similarly. Densitometry analysis of LC3-II and SQSTM1 levels relative to ACTB was performed using Image J software.

An official website of the United States government
Here's how you know
Official websites use .gov
A
.gov website belongs to an official
government organization in the United States.
Secure .gov websites use HTTPS
A lock (
) or https:// means you've safely
connected to the .gov website. Share sensitive
information only on official, secure websites.
