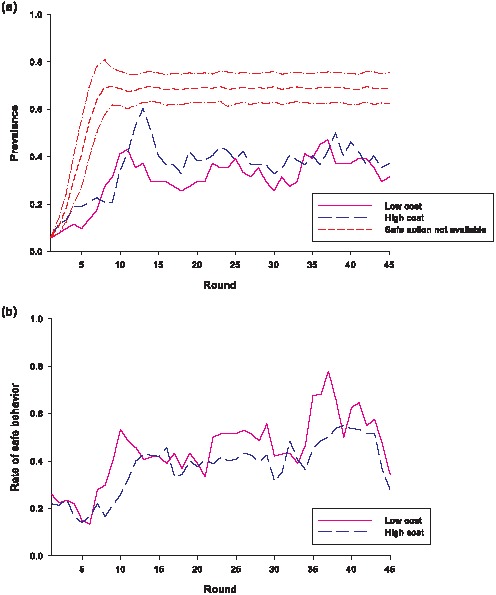
Figure 1. Prevalence of disease and rate of safe behavior in the game.

(a) The fraction of players that were infected in each condition. Using computer simulation results, the short dash line shows the mean prevalence over time if no one ever chooses the safe behavior. The computational model used the same parameter values as the virtual epidemics game and had 50 players, with three chosen to be infected in round 1. The simulations were run 500 times, and the two dash-dot lines indicate 1 standard deviation above and below the mean. (b) The fraction of healthy players that chose the safe action in each condition.
