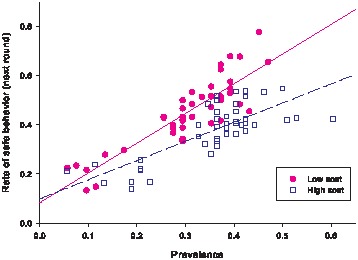
Figure 2. The relationship between prevalence and rate of safe behavior in the following round.

The solid and dash lines are the regression lines for the low and high cost conditions, respectively.

The solid and dash lines are the regression lines for the low and high cost conditions, respectively.