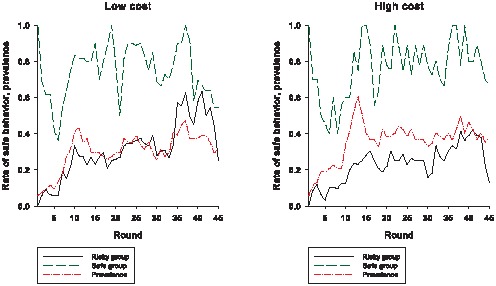
Figure 4. Comparing the rate of safe behavior among those whose first action was the risky action to the rate of safe behavior among those whose first action was the safe action.

The “safe” group is composed of those players whose first action was safe. For the low cost condition, there are 13 players in the safe group; for the high cost condition, there are 11 players in the safe group. The “risky” group is composed of those players whose first action was risky. For the low cost condition, there are 38 players in the risky group; for the high cost condition, there are 40 players in the risky group.
